. 2014 Jul;26(7):1427-36.
doi: 10.1016/j.cellsig.2014.02.017. Epub 2014 Mar 5.

Redox control of p53 in the transcriptional regulation of TGF-β1 target genes through SMAD cooperativity

Affiliations

Redox control of p53 in the transcriptional regulation of TGF-β1 target genes through SMAD cooperativity

Jessica M Overstreet et al. Cell Signal. 2014 Jul.

Abstract

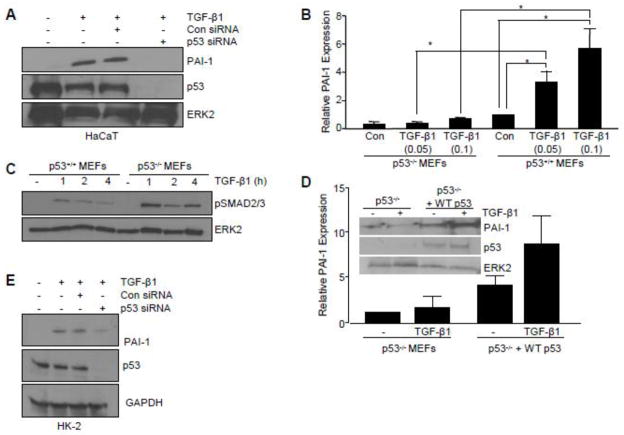
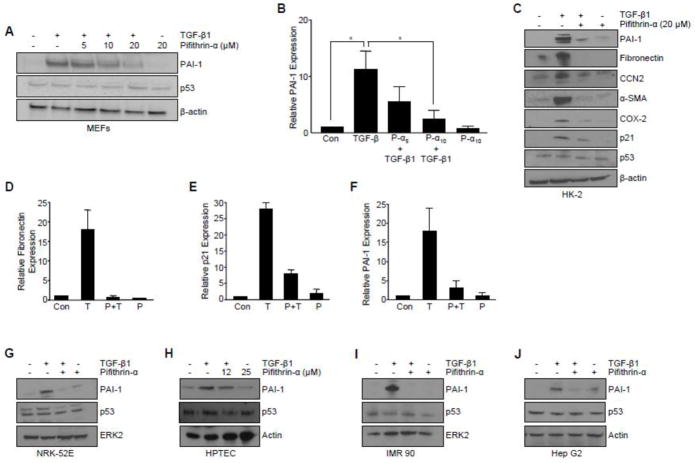
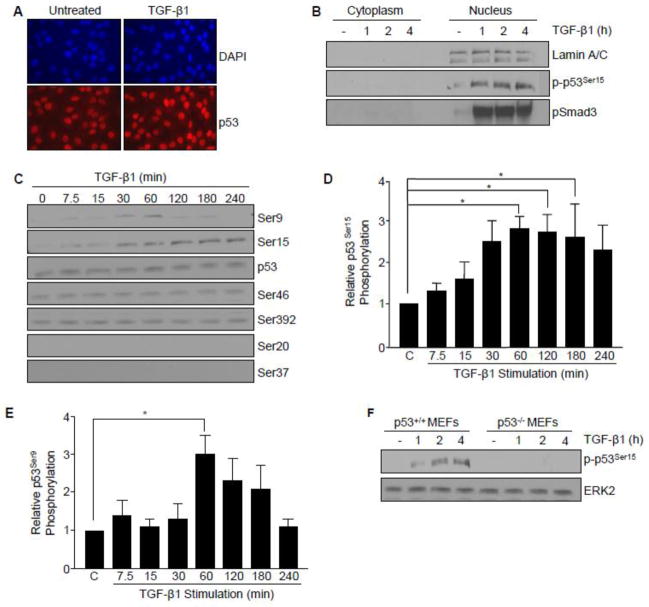
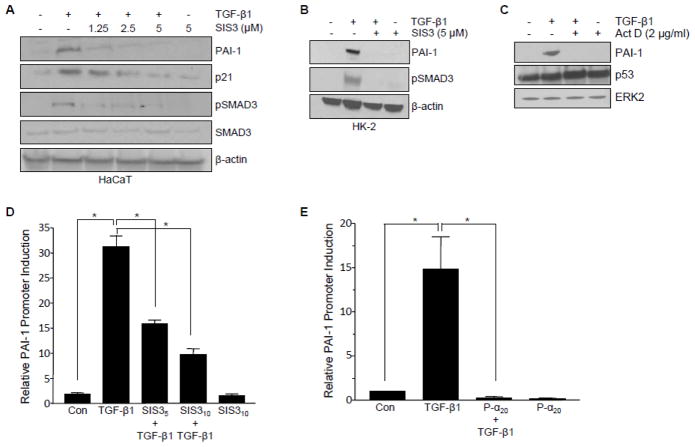
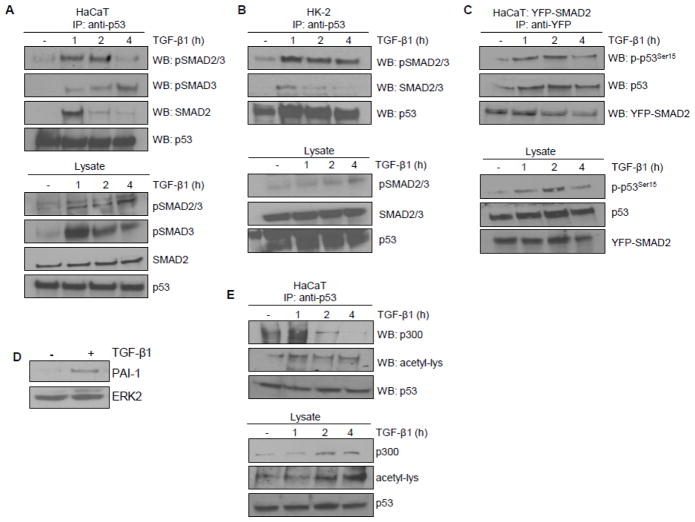
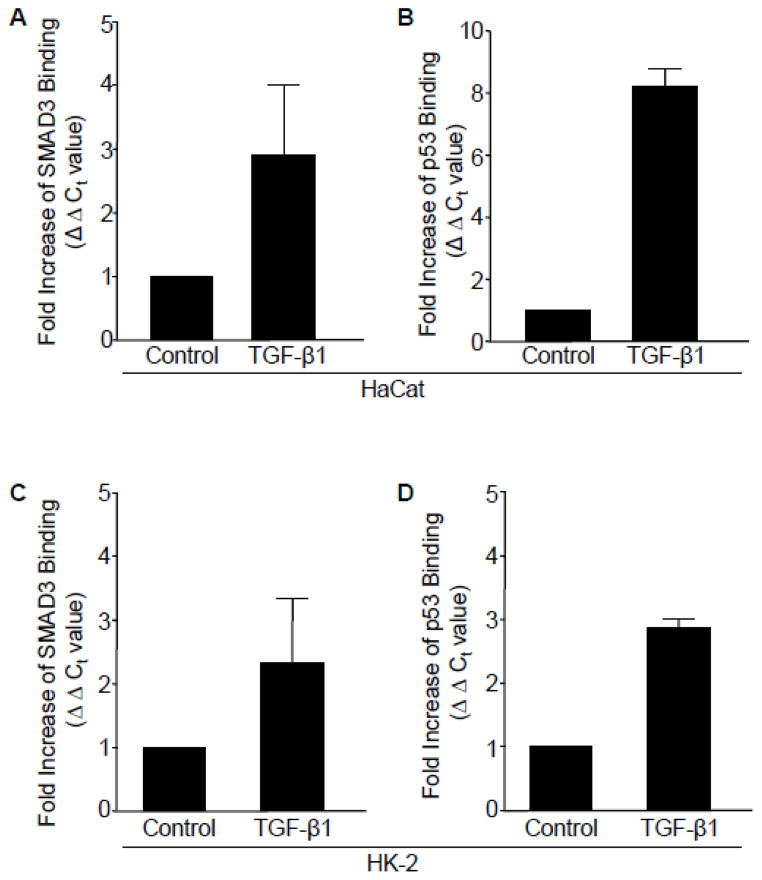
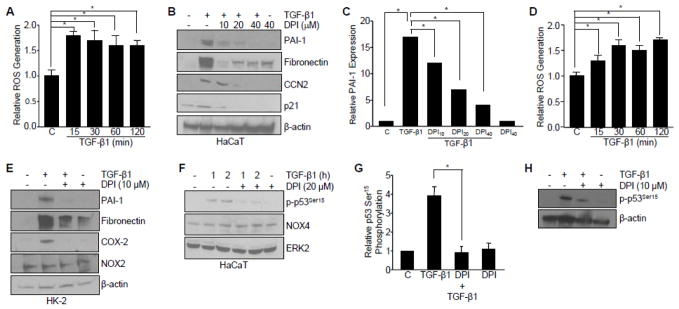
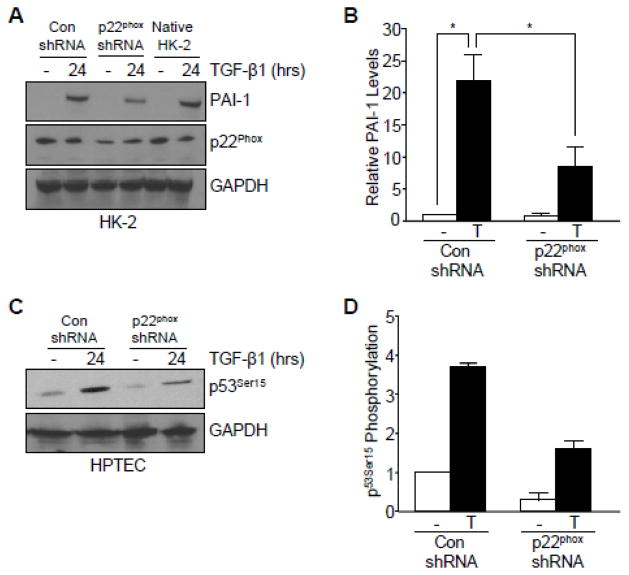
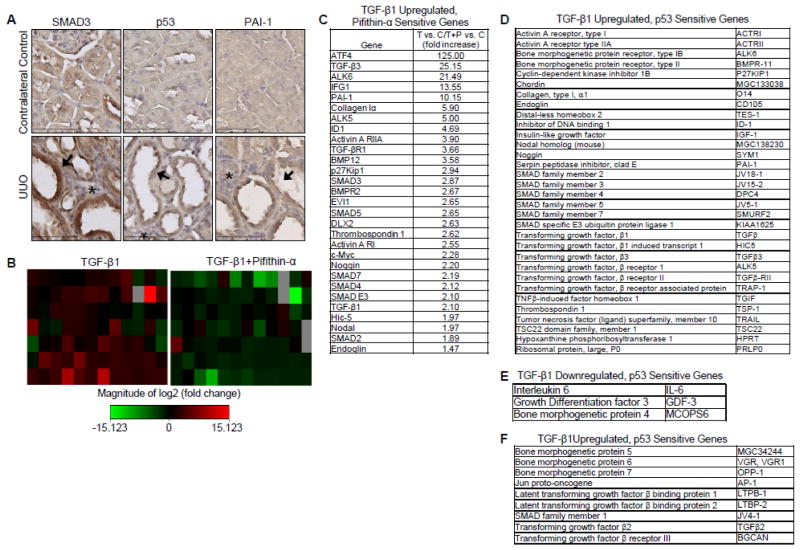
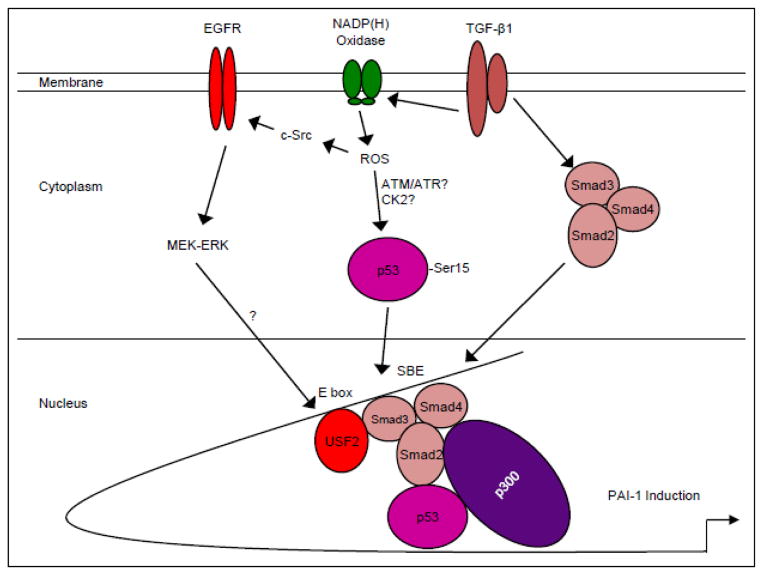
Transforming growth factor-β1 (TGF-β1) regulates the tissue response to injury and is the principal driver of excessive scarring leading to fibrosis and eventual organ failure. The TGF-β1 effectors SMAD3 and p53 are major contributors to disease progression. While SMAD3 is an established pro-fibrotic factor, the role of p53 in the TGF-β1-induced fibrotic program is not clear. p53 gene silencing, genetic ablation/subsequent rescue, and pharmacological inhibition confirmed that p53 was required for expression of plasminogen activator inhibitor-1 (PAI-1), a major TGF-β1 target gene and a key causative element in fibrotic disorders. TGF-β1 regulated p53 activity by stimulating p53(Ser15 and 9) phosphorylation and acetylation, promoting interactions with activated SMADs and subsequent binding of p53/SMAD3 to the PAI-1 promoter in HK-2 human renal tubular epithelial cells and HaCaT human keratinocytes. Immunohistochemistry revealed prominent co-induction of SMAD3, p53 and PAI-1 in the tubular epithelium of the obstructed kidney consistent with a potential in vivo role for p53 and SMADs in TGF-β1-driven renal fibrosis. TGF-β1-initiated phosphorylation of p53(Ser15) and up-regulation of expression of several pro-fibrotic genes, moreover, was dependent on the rapid generation of reactive oxygen species (ROS). shRNA silencing of the p22(Phox) subunit of NADP(H) oxidases in HK-2 cells partially attenuated (over 50%) p53(Ser15) phosphorylation and PAI-1 induction. These studies highlight the role of free radicals in p53 activation and subsequent pro-fibrotic reprogramming by TGF-β1 via the SMAD3-p53 transcriptional axis. Present findings provide a rationale for therapeutic targeting of SMAD3-p53 in aberrant TGF-β1 signaling associated with renal fibrosis.

Keywords: Chromatin immunoprecipitation; Gene expression; PAI-1; Reactive oxygen species; SMADs; TGF-β1; Tissue fibrosis; Transcription; p53.


Conflict of interest statement

Disclosure

The authors have no conflict of interest.

Figures

Figure 1
Figure 1. Critical role of p53 in TGF-β target gene expression
(A) Western analysis indicated that PAI-1 induction by TGF-β1 (2 ng/ml) was inhibited by transfection of HaCaT keratinocytes with SMARTpool p53 siRNA compared to control siRNA. Assessment of p53 levels confirmed knockdown efficacy. (B) Histogram illustrating PAI-1 expression at indicated TGF-β1 concentrations (0.05, 0.1 ng/ml) in p53+/+ and p53−/− mouse embryonic fibroblasts (MEFs). Data plotted represents mean ± standard deviation (s.d.) of three independent studies; Statistical significance for each condition was calculated using the t-test. *p<0.05.”. (C) Western analysis of increased phosphorylated SMAD2/3 (pSMAD2/3) in MEFs in response to TGF-β1 treatment indicates an intact TGF-β1 signaling network in p53−/− MEFs. (D) Western blotting of p53−/− MEFs transfected to stably-express control empty vector (p53−/−) or p53 cDNA (p53−/− +WTp53) followed by TGF-β1 stimulation confirmed successful reexpression of p53 following cDNA transfection and selection in neomycin. (E) Immunoblotting of TGF-β1-mediated PAI-1 expression following p53 knockdown in HK-2 cells. Blot of p53 confirms knockdown efficiency. TGF-β1 exposure was for 5 hours (A, B, D) or 24 hours (E). ERK2 (A, C, D) and GAPDH (E) served as loading controls.
Figure 2
Figure 2. Pharmacological inhibition of p53 attenuates TGF-β-mediated target gene expression
(A) Effect of pretreatment with the p53 pharmacological inhibitor Pifithrin-α at indicated doses (5, 10, 20 ΔM) on TGF-β1-induced PAI-1 expression in p53+/+ MEFs. Graph (B) depicts mean ± s.d. of three independent studies; statistical significance determined with t-test *p<0.05. (C) Pifithrin-α blocked TGF-β1-induced expression of a subset of pro-fibrotic genes (i.e., PAI-1, fibronectin, CTGF/CCN2, α-SMA), the pro-inflammatory cytokine (i.e., COX-2), and a growth arrest gene (i.e., p21) in HK-2 human renal proximal tubular epithelial cells. Histogram in (D–F) quantitates the effect of Pifithrin-α on TGF-β1-dependent fibronectin, p21, and PAI-1 expression, respectively, as determined in replicate independent experiments. Pifithrin-α pretreatment effectively blocked PAI-1 induction in NRK-52E rat (G) and primary human proximal tubular epithelial cells (H). Pretreatment with p53 inhibitor Pifithrin-α abrogated TGF-β1-mediated PAI-1 levels in IMR-90 human lung fibroblasts (I) and HepG2 human hepatocytes (J). TGF-β1 exposure was for 5 hours (A, B, H–J) or 24 hours (C–G). β-actin (A, C, H, J) and ERK2 (G, I) served as loading controls.
Figure 3
Figure 3. Post-translational modification of p53 by TGF-β
(A) Immunofluorescence staining of the expression and localization of p53 (red) in untreated and TGF-β1 (1 hr) treated HaCaT cells. Nuclei (blue) were visualized by 4,6-diamidino-2-phenylindole (DAPI) staining. (B) Isolation of cytoplasmic and nuclear fractions in HaCaT keratinocytes. Immunoblot analysis confirmed TGF-β1-induced expression, subcellular localization, and kinetics of phosphorylated p53Ser15 (p-p53Ser15) and phosphorylated SMAD3 (pSMAD3) over a time course preceding optimal target gene expression (i.e. PAI-1). Lamin A/C provided a biochemical marker of the nuclear compartment. (C) Immunoblot assessment of specific p53 serine phosphorylation sites in response to TGF-β1. TGF-β1 treatment, up to 4 hours, did not significantly alter total p53 expression levels. (D, E) Histograms illustrate kinetics of TGF-β1-induced p53Ser15 and p53Ser9 phosphorylation, respectively, as mean ± s.d. of three separate experiments. (F) TGF-β1 promotes p53Ser15 phosphorylation in a time-dependent manner in p53+/+, but not p53−/− MEFs.
Figure 4
Figure 4. Requirement for pSMAD3 and p53 in TGF-β1-induced transcription
(A, B) Effect of the SMAD3 pharmacological inhibitor SIS3 on TGF-β1-induced PAI-1 and p21 expression in HaCaT (A) and HK-2 (B) cells. Blockade of SMAD3 phosphorylation confirmed the functionality of SIS3. β-actin served as loading control (A, B). (C) Effect of global blockade of transcription via actinomycin D on TGF-β1-mediated PAI-1 protein expression. Total p53 levels remained equal. ERK2 provided as loading control. Luciferase reporter analysis in Mv1Lu-800bp-Luc cells. Histograms depict the mean± s.d. for triplicate experiments of TGF-β1-mediated PAI-1 promoter activation (16 hrs), measured by luciferase emission, in the presence of SIS3 (D) or Pifithrin-α (E) at indicated doses; t-test determined statistical significance *p<0.05.
Figure 5
Figure 5. Transcriptional complex formation involving p53/SMAD3/p300 in response to TGF-β1
(A,B) Immunoprecipitation analysis of p53 interactions with SMAD proteins. (A) Immunoprecipitation of endogenous p53 followed by immunoblotting for activated SMADs (pSMAD2/3, pSMAD3) and total SMAD2 following TGF-β1 (1, 2, 4 hr) treatment in HaCaT cells. Western analysis of lysates assessed the presence and phosphorylation status of SMADs in response to TGF-β1 exposure. Equivalent levels of immunoprecipated p53 was confirmed by immunoblotting. (B) p53 similarly interacts with activated and total SMAD2/3 in HK-2 cells. (C) Immunoprecipitation of ectopically-expressed YFP-SMAD2 in HaCaT cells followed by immunoblotting of activated (p-p53Ser15) and total p53. Pull down efficiency confirmed by western blotting with YFP antibody. (D) Retention of PAI-1 induction by TGF-β1 in YFP-SMAD2 HaCaT cells. (E) Immunoprecipitation of endogenous p53 followed by immunoblotting for p300 and acetyl-lysine (acetyl-lys) upon TGF-β1 stimulation of HaCaT keratinocytes.
Figure 6
Figure 6. Simultaneous occupancy of SMAD3 and p53 on TGF-β1 target PAI-1 promoter
(A–D) Chromatin immunoprecipiation (ChiP) analysis using antibodies targeting SMAD3 or p53 following 2 hour TGF-β1 treatment and subsequent RT-PCR analysis, using primers encompassing the SMAD and p53 response elements in the PAI-1 promoter. Data plotted indicates the fold-increase in SMAD3 (A) or p53 (B) binding (calculated by ΔΔCt values) in HaCaT cells. TGF-β1 stimulation (for 24 hr) also increased SMAD3 (C) and p53 (D) occupancy on the PAI-1 promoter in HK-2 cells. Graphs (A–D) represent mean ± s.d. of triplicate experiments.
Figure 7
Figure 7. TGF-β induction of target genes and phosphorylation of p53Ser15 is ROS-dependent
(A) Rapid ROS generation as assessed by 2′,7′-dichlorfluorescein-diacetate (DCF-DA) emission during the time course of TGF-β1 treatment (0, 15, 30, 60, 120 min) in HaCaT cells. Graph represents mean ± s.d. of three independent experiments; *p<0.05. (B) Western analysis of the effect of pretreatment with the ROS inhibitor diphenyleneiodonium chloride (DPI) on TGF-β1-dependent target gene expression (5 hrs) in HaCaT cells. (C) Graph of PAI-1 protein expression illustrating the mean ± s.d. of three replicate experiments; *p<0.05. (D) TGF-β1 rapidly generates ROS, as measured using DCF-DA, in HK-2 proximal tubular epithelial cells. (E) Inhibition of ROS with DPI blocks TGF-β1-mediated PAI-1, fibronectin, and COX-2 expression (for 24 hrs) in HK-2 cells. (F–H) Effect of ROS inhibition by DPI on TGF-β1-stimulated p53Ser15 phosphorylation in HaCaT (F, G) and HK-2 (H) cells. Bar graph in (G) represents the mean ± s.d. of three separate immunoblots from (F); *p<0.05. β-actin (B, E, H) and ERK2 (F) are loading controls. Statistical significance of the indicated groups was calculated by t-test in histograms (A, C, D, G).
Figure 8
Figure 8. Involvement of p22phox in TGF-β1-mediated target gene expression and p53 activation
(A, B) Genetic silencing of p22phox attenuated PAI-1 expression following TGF-β1 exposure in HK-2 cells. Histogram in (B) illustrates the mean ± s.d. of two separate experiments from (I). (C, D) TGF-β1-induced p53Ser15 phosphorylation was abrogated following knockdown of p22phox in human proximal tubular epithelial cells. Graph in (D) depicts the mean ± s.d. of two separate immunoblots from (C). GAPDH (A, C) serves as a loading control. Statistical significance of the indicated groups was calculated by t-test (B, D).
Figure 9
Figure 9. Prominent co-localization of SMAD3 and p53 correlate with increased PAI-1 expression in the tubular epithelium of obstructed rat kidneys
(A) Representative immunohistochemical images for SMAD3, p53, and PAI-1 localization in contralateral control (top) and obstructed UUO (bottom) rat kidneys. Nuclei were counterstained with hematoxylin. Arrows indicate tubular dilation while asterisks indicate interstitial expansion consistent with UUO-induced renal fibrosis. Contralateral kidneys without surgical manipulation served as control. (B) Heat maps of 24-hr TGF-β1-stimulated HK-2 tubular epithelial cells with or without Pifithrin-α pretreatment prior to analysis of mRNA transcripts using the TGF-β/BMP pathway PCR Array. Fold increase or decrease of gene expression is depicted as red and green, respectively. (C) Microarray results of selected target genes upregulated by TGF-β1 and sensitive to pifithrin-α pretreatment. Genes identified by PCR Array were classified as (D) TGF-β1Upregulated, p53 Sensitive Genes, (E) TGF-β1 Downregulated, p53 Sensitive Genes, and (F) TGF-β1 Upregulated, p53 Insensitive.
Figure 10
Figure 10. Hypothetical model of TGF-β1-induced PAI-1 transcription
TGF-β1 receptor activation initiates both SMAD2/3 phosphorylation, via the ALK5/type I TGF-β1 receptor, as well as non-SMAD (e.g. EGFR, MAPK, c-Src) signaling cascades. These pathways have downstream consequences on gene expression (e.g. PAI-1, ECM structural elements) as well as cellular phenotypic responses (e.g., excessive matrix deposition/ fibrosis, myofibroblast induction, growth arrest). TGF-β1 stimulates ROS-dependent EGFRY845 transactivation by pp60c-src which initiates, in turn, downstream MAP kinase (e.g. ERK, p38) pathway signaling to promote a USF1 to USF2 activator switch at the PE2 site E box of the PAI-1 promoter [15]. TGF-β1 generation of ROS phosphorylates p53 leading to complex formation with SMAD2/3/4 and p300 on the PAI-1 promoter inducing optimal PAI-1 transcription.

Similar articles

Cited by

References

    1. Lopez-Hernandez FJ, Lopez-Novoa JM. Cell Tissue Res. 2012;347:141–154. - PubMed
    1. Toma I, McCaffrey TA. Cell Tissue Res. 2012;347:155–175. - PMC - PubMed
    1. Massague J. Cell. 2008;134:215–230. - PMC - PubMed
    1. Derynck R, Zhang RYE. Nature. 2003;425:577–584. - PubMed
    1. Cordenonsi M, Montagner M, Adorno M, Zacchigna L, Martello G, Mamidi A, Soligo S, Dupont S, Piccolo S. Science. 2007;315:840–843. - PubMed

Publication types

MeSH terms

LinkOut - more resources