. 2014 Apr;124(4):1699-710.
doi: 10.1172/JCI71520. Epub 2014 Mar 10.

HBS1L-MYB intergenic variants modulate fetal hemoglobin via long-range MYB enhancers

HBS1L-MYB intergenic variants modulate fetal hemoglobin via long-range MYB enhancers

Ralph Stadhouders et al. J Clin Invest. 2014 Apr.

Abstract

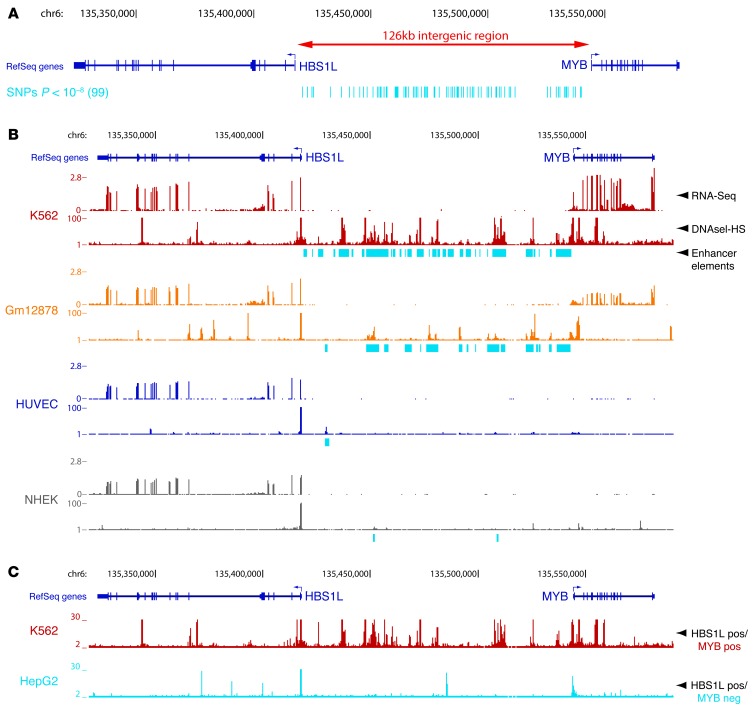
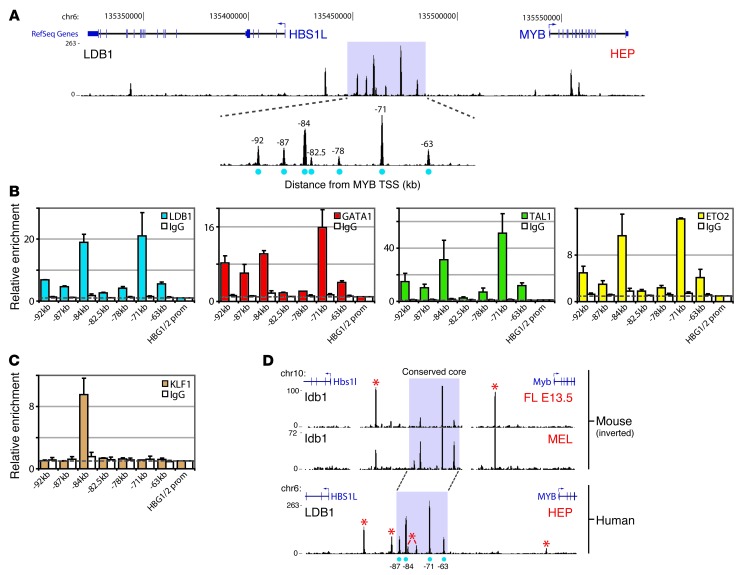
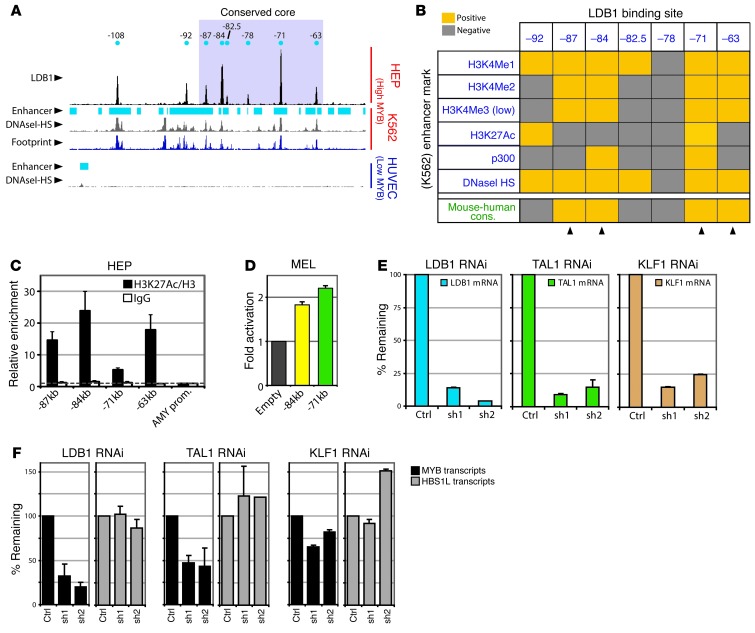
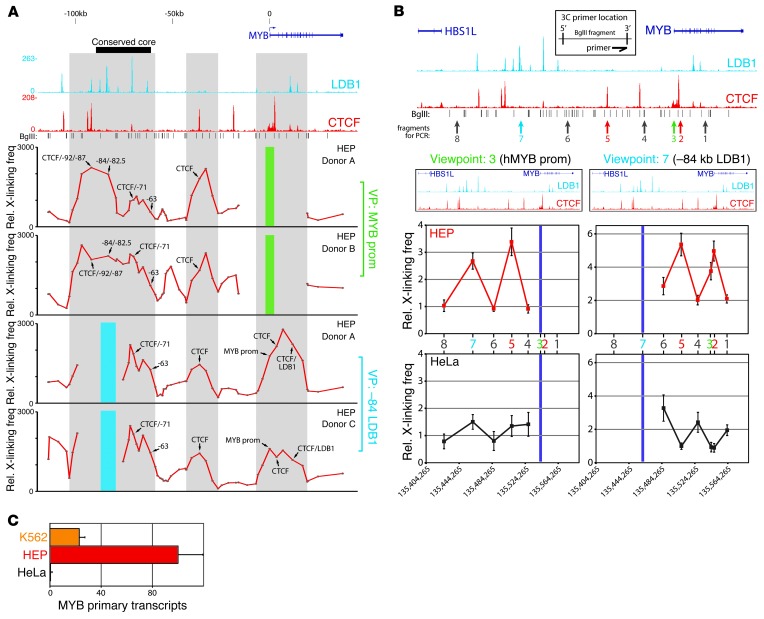
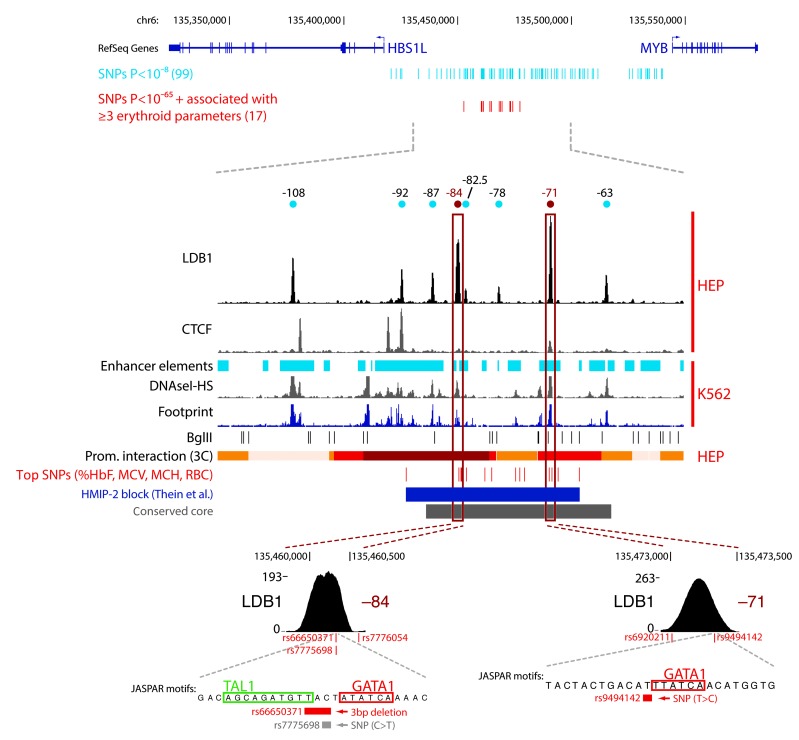
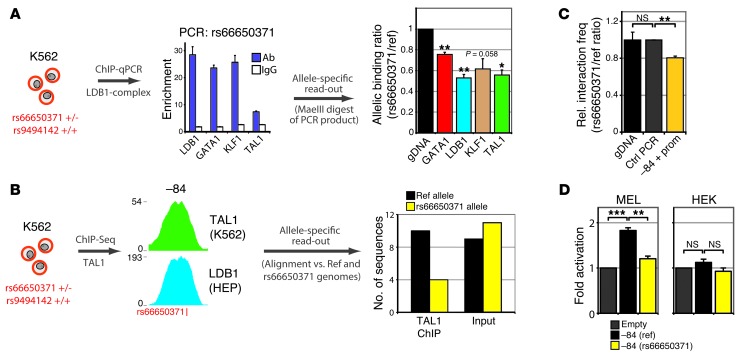
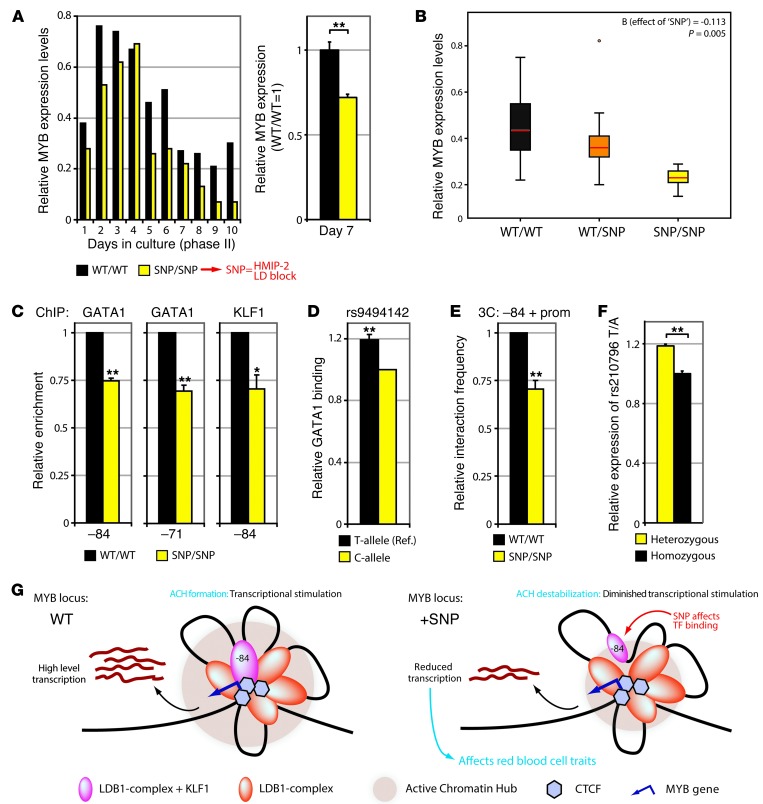
Genetic studies have identified common variants within the intergenic region (HBS1L-MYB) between GTP-binding elongation factor HBS1L and myeloblastosis oncogene MYB on chromosome 6q that are associated with elevated fetal hemoglobin (HbF) levels and alterations of other clinically important human erythroid traits. It is unclear how these noncoding sequence variants affect multiple erythrocyte characteristics. Here, we determined that several HBS1L-MYB intergenic variants affect regulatory elements that are occupied by key erythroid transcription factors within this region. These elements interact with MYB, a critical regulator of erythroid development and HbF levels. We found that several HBS1L-MYB intergenic variants reduce transcription factor binding, affecting long-range interactions with MYB and MYB expression levels. These data provide a functional explanation for the genetic association of HBS1L-MYB intergenic polymorphisms with human erythroid traits and HbF levels. Our results further designate MYB as a target for therapeutic induction of HbF to ameliorate sickle cell and β-thalassemia disease severity.


Figures

Figure 1
Figure 1. The erythroid/hematopoietic-specific regulatory signature of the HBS1L-MYB intergenic region associated with HbF levels and other human erythroid traits.
(A) Intergenic SNPs associated (P < 10–8) with different erythroid phenotypes (listed in Table 1) as reported by published GWAS (Table 1) are plotted below the HBS1L-MYB locus. (B) Locus-wide expression, DNaseI hypersensitivity, and enhancer chromatin signature data for 4 different cell types representing erythrocytes (K562), lymphocytes (Gm12878), endothelial cells (HUVEC) and keratinocytes (NHEK). The y axis represents sequence tag density. (C) Locus-wide digital genomic footprinting data shown for an erythroid cell line (K562) expressing both MYB and HBS1L (HBS1L pos/MYB pos) and for a liver cell line (HepG2) expressing only HBS1L (HBS1L pos/MYB neg). The y axis represents sequence tag density. Genome-wide data sets were obtained from the ENCODE consortium and accessed through the UCSC Genome Browser ( http://genome.ucsc.edu/). DNaseI-HS, DNaseI hypersensitivity.
Figure 2
Figure 2. The HBS1L-MYB intergenic region contains regulatory elements bound by erythroid TFs.
(A) LDB1 ChIP-Seq data from primary HEPs. LDB1 peaks were marked by their distance to the MYB TSS. (B and C) ChIP-qPCR data (HEPs) showing enrichment (n = 3) for LDB1 complex members (B) and KLF1 (C) at the intergenic binding sites. IgG serum was used as control (IgG); the HBG1/2 promoter for normalization. (D) Comparison of mouse and human LDB1 ChIP-Seq data from erythroid progenitors. Binding sites not conserved are marked (*). The region containing the 4 conserved sites (conserved core) is highlighted in purple. Error bars display SEM. FL E13.5, 13.5 dpc fetal liver erythroid progenitors.
Figure 3
Figure 3. Erythroid TFs bind intergenic enhancer regions and are required for MYB expression.
(A) Alignment of LDB1-binding sites (HEPs) to enhancer chromatin signature, DNaseI-HS, and footprinting data from erythroid (K562) and endothelial (HUVEC) cell lines. (B) Table summarizing the comparison between LDB1 sites (HEPs) and enhancer marks (K562). Arrowheads denote conserved sites with highly enriched enhancer signatures. (C) H3K27 acetylation as measured by ChIP-qPCR in HEPs for indicated LDB1-binding sites (n = 2). Enrichments were corrected for total H3 levels and normalized to the AMY2A promoter (AMY prom.). (D) Luciferase reporter assays in MEL cells measuring (n = 3) enhancer activity of the –84-kb and –71-kb elements. Promoter activity without enhancer (empty) was set to 1. (E and F) Gene expression analysis (n = 3) on K562 cells depleted for the indicated TFs by RNAi. A scrambled shRNA was used as control (Ctrl). Error bars display SEM.
Figure 4
Figure 4. 3C analysis of the HBS1L-MYB locus reveals long-range interactions between intergenic elements and the MYB gene.
(A) 3C-Seq analysis performed on primary HEPs from 3 different donors using the MYB promoter (green bar) or the –84 regulatory element (blue bar) as a viewpoint (VP). LDB1 and CTCF ChIP-Seq results from primary HEPs and gene locations are shown at the top. Gray shading highlights regions of coinciding protein binding and chromatin looping. The y axis represents relative crosslinking frequencies per BglII fragment as measured by sequence tag density. (B) 3C-qPCR experiments on primary HEPs (red, n = 5) and HeLa cells (gray, n = 3) using the same viewpoints as in A. The locus is plotted on top, with the different 3C restriction fragments (BglII) used for PCR indicated. A schematic depicting the location of the primers on the chosen restriction fragments is shown. Interaction frequencies between 2 fragments within the ERCC3 locus were used for normalization. (C) Gene expression analysis (n = 3) of MYB transcript levels in the different cell types used for the 3C analysis. ACTB levels were used for normalization. Error bars display SEM.
Figure 5
Figure 5. Intergenic polymorphisms associated with HbF and other erythroid parameters localize to the intergenic regulatory elements.
All published intergenic SNPs associated with human erythroid traits (P < 10–8; blue) and the most highly associated (P < 10–65 and 3 or more major erythroid parameters [%HbF, MCV, MCH and RBC]; red) variants are shown directly under MYB and HBS1L gene locations. Below, a zoom-in picture of the LDB1 binding-site cluster and its regulatory signature is further compared with the location of the conserved core (gray), HMIP-2 block (dark blue) and the 17 highly associated candidate SNPs. Chromatin looping with the MYB promoter (Figure 4A) is depicted on a white (no interaction) to red (strong interaction) color gradient. Two additional zoom-in pictures display the locations of the SNPs relative to the TF-binding motifs (identified by JASPAR) within the –84 and –71 sites. Within the –84 element, rs66650371 is the actual associated variant (in red; see Results for details).
Figure 6
Figure 6. rs66650371 affects protein binding, chromatin looping, and enhancer activity within the erythroid HBS1L-MYB locus.
(A) Allele-specific ChIP experiments for the rs66650371 alleles in K562 cells heterozygous for this variant. Occupancy of rs66650371 (within the –84 element) by LDB1, GATA1, TAL1, and KLF1 was measured by ChIP-qPCR (n = 2, normalized against AMY2A promoter values), followed by an allele-specific read-out using MaeIII digestion (n = 2, see Methods and Supplemental Figure 4). Allelic abundance was expressed as a rs66650371 (minor)/reference (major) ratio, which was set to 1 for genomic DNA (gDNA). A ratio of less than 1 is the result of a relative lower abundance of the rs66650371 minor allele in the ChIP samples. (B) TAL1 ChIP-Seq was performed in K562 cells, and sequence reads were mapped against the reference and rs66650371 (containing the minor 3-bp deletion allele) genomes. K562 input genomic DNA was PCR amplified (amplicon spanning rs66650371) and cloned into a plasmid; colonies were sequenced (n = 20). (C) Allele-specific quantification (n = 3) of chromatin looping between the –84 element and the MYB promoter in K562 cells. A long-range PCR approach was combined with an MaeIII digestion-based read-out for quantification (see Methods). (D) Luciferase reporter assays measuring enhancer activity of the reference (ref.) and rs66650371 minor –84 enhancer alleles in erythroid (MEL) and nonerythroid (HEK) cells. Error bars display SEM. Statistical significance was determined using Student’s t test. *P < 0.05; **P < 0.01; ***P < 0.001.
Figure 7
Figure 7. Intergenic variants affect TF binding, chromatin looping, and MYB expression in primary HEPs.
(A) HEPs from individuals homozygous for the minor allele of the phenotype-associated variants (HMIP-2 LD block variants; SNP/SNP) and WT control individuals (WT/WT) were cultured and assayed for MYB expression at indicated days (left: representative experiment, right: n = 4). (B) Correlation between intergenic genotype and MYB expression was determined using HEPs from 21 individuals (WT/WT, WT/SNP, and SNP/SNP intergenic genotypes; see Methods). Circle represents single data point considered to be an outlier. (C) ChIP-qPCR (n = 3) for GATA1/KLF1 using SNP/SNP and WT/WT HEPs. Enrichments were normalized to IgG and α-globin HS40 values (WT/WT set to 1). (D) Allele-specific measurement of GATA1 binding to rs9494142 (T/C) alleles using SNaPshot on heterozygous individuals (n = 4). rs9494142 C is the phenotype-associated minor allele. (C-allele set to 1). (E) Interaction frequencies between the –84 element and MYB promoter were measured (n = 5) using 3C-qPCR in SNP/SNP and WT/WT HEPs. (F) Allele-specific expression measured by SNaPshot in HEPs from individuals heterozygous (n = 5) or homozygous (n = 5) for the intergenic SNPs; rs210796 SNP (T/A) was used for quantification. (G) Proposed model explaining the effect of trait-associated intergenic SNPs on MYB regulation. Transcription factor-bound regulatory elements cluster around MYB to form an ACH, stimulating transcription (left). Intergenic SNPs reduce TF binding and chromatin looping, partially destabilizing the ACH and reducing MYB transcription (right). Lower MYB levels subsequently affect red cell traits. Error bars display SEM. Statistical significance was determined using linear regression analysis or Student’s t test. *P < 0.05; **P < 0.01.

References

    1. Evans DM, Frazer IH, Martin NG. Genetic and environmental causes of variation in basal levels of blood cells. Twin Res. 1999;2(4):250–257. doi: 10.1375/twin.2.4.250. - DOI - PubMed
    1. Garner C, et al. Genetic influences on F cells and other hematologic variables: a twin heritability study. Blood. 2000;95(1):342–346. - PubMed
    1. Maurano MT, et al. Systematic localization of common disease-associated variation in regulatory DNA. Science. 2012;337(6099):1190–1195. doi: 10.1126/science.1222794. - DOI - PMC - PubMed
    1. Thein SL, et al. Intergenic variants of HBS1L-MYB are responsible for a major quantitative trait locus on chromosome 6q23 influencing fetal hemoglobin levels in adults. Proc Natl Acad Sci U S A. 2007;104(27):11346–11351. doi: 10.1073/pnas.0611393104. - DOI - PMC - PubMed
    1. Menzel S, et al. The HBS1L-MYB intergenic region on chromosome 6q23.3 influences erythrocyte, platelet, and monocyte counts in humans. Blood. 2007;110(10):3624–3626. doi: 10.1182/blood-2007-05-093419. - DOI - PubMed

Publication types

Associated data