. 2014 Mar 10;9(3):e89919.
doi: 10.1371/journal.pone.0089919. eCollection 2014.

Approaches to improve the oral bioavailability and effects of novel anticancer drugs berberine and betulinic acid

Affiliations

Approaches to improve the oral bioavailability and effects of novel anticancer drugs berberine and betulinic acid

Chandraiah Godugu et al. PLoS One. .

Abstract

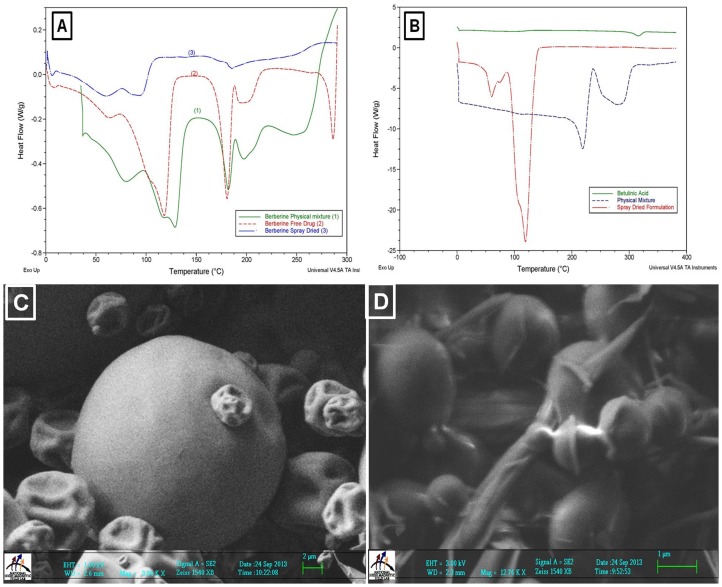
Background: The poor bioavailability of Berberine (BBR) and Betulinic acid (BA) limits the development of these promising anticancer agents for clinical use. In the current study, BBR and BA in spray dried (SD) mucoadhesive microparticle formulations were prepared.

Methods: A patented dual channel spray gun technology established in our laboratory was used for both formulations. Gastrointestinal (GI) permeability studies were carried out using Caco-2 cell monolayer grown in in-vitro system. The oral bioavailability and pharmacokinetic profile of SD formulations were studied in Sprague Dawley rats. A549 orthotopic and H1650 metastatic NSCLC models were utilized for the anticancer evaluations.

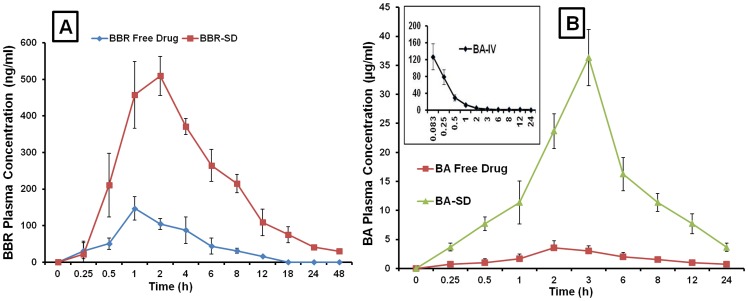
Results: Pharmacokinetic studies demonstrated that BBR and BA SD formulations resulted in 3.46 and 3.90 fold respectively, significant increase in plasma Cmax concentrations. AUC levels were increased by 6.98 and 7.41 fold in BBR and BA SD formulations, respectively. Compared to untreated controls groups, 49.8 & 53.4% decrease in the tumor volumes was observed in SD formulation groups of BBR and BA, respectively. Molecular studies done on excised tumor (A549) tissue suggested that BBR in SD form resulted in a significant decrease in the survivin, Bcl-2, cyclin D1, MMP-9, HIF-1α, VEGF and CD31 expressions. Cleaved caspase 3, p53 and TUNEL expressions were increased in SD formulations. The RT-PCR analysis on H1650 tumor tissue suggested that p38, Phospho-JNK, Bax, BAD, cleaved caspase 3&8 mRNA expressions were significantly increased in BA SD formulations. Chronic administration of BBR and BA SD formulations did not show any toxicity.

Conclusions: Due to significant increase in oral bioavailability and superior anticancer effects, our results suggest that spray drying is a superior alternative formulation approach for oral delivery of BBR and BA.


Conflict of interest statement

Competing Interests: The authors have declared that no competing interests exist.

Figures

Figure 1
Figure 1. Characterization of BBR-SD and BA-SD formulations.
A) DSC analysis of BBR free drug, Physical mixture and BBR-SD formulation. B) DSC analysis of BA free drug, Physical mixture and BA-SD formulation. Scanning electron microscopic analysis of C) BBR-SD and D) BA-SD formulation by using Zeiss FESEM.
Figure 2
Figure 2. In vitro evaluation of BBR-SD and BA-SD formulations.
A) In vitro drug release profile of BBR in free drug, physical mixture and SD form. B) Final drug release profile of BBR in free drug, physical mixture and BBR-SD formulation forms after 48 h. C) In vitro release profile of BA in free drug and SD form. D) % final drug dissolution profile after 24 h in BA free drug and BA-SD formulations. E) Caco-2 permeability of BBR in free drug and BBR-SD form, % of BBR permeated from apical to basolateral compartment. F) Caco-2 permeability of BA in free drug and BA-SD form, % of BA permeated from apical to basolateral compartment. Each data point was represented as mean±sem (n = 3–4). ***p<0.001 Vs respective free drug groups.
Figure 3
Figure 3. Pharmacokinetic profiles of BBR-SD and BA-SD formulations.
A) Plasma concentration time profile of BBR free drug and BBR-SD formulation in Sprague Dawley rats. B) Plasma concentration time profile of BA free drug and BA-SD formulation in Sprague Dawley rats. In both the studies, rats were administered at the dose of 100 mg/kg, orally. Figure 3B also shows the plasma concentration and time profiles of BA upon intravenous administration. Each data point was represented as mean±sem (n = 3–4).
Figure 4
Figure 4. Anticancer effects of BBR-SD formulations in orthotopic lung cancer model.
A) Lung tumor weights after treatment with BBR free drug and BBR-SD formulations in A549 orthotopic lung tumor models, B) Lung tumor volumes after treatment with BBR free drug and BBR-SD formulations in A549 orthotopic lung tumor models, C) Representative lung tumor images taken from control, BBR free drug and BBR-SD treated (3 weeks daily 100 mg/kg dose) animals. Each data point was represented as mean±sem (n = 6–8). *p<0.05 and ***p<0.001 Vs respective untreated control groups.
Figure 5
Figure 5. Western Blot analysis of orthotopic lung tumors lysates.
A) Western blot images of Bcl-2, survivin, cyclin D1, p53, MMP-9, HIF-1α and β-actin expression in control, BBR free drug and BBR-SD formulation treated tumor lysates. B) Densitometric analysis of β-actin relative expression of C) Bcl-2 and C) survivin. Each data point was represented as mean±sem (n = 3–4). ***p<0.001 Vs respective untreated control groups.
Figure 6
Figure 6. Western blot Densitometric analysis.
A) Densitometric analysis of β-actin relative expression of A) cyclin D1, B) p53, C) MMP-9 and D) HIF-1α. Each data point was represented as mean±sem (n = 3–4). ***p<0.001 Vs respective untreated control groups.
Figure 7
Figure 7. Immunohistochemical (IHC) analysis of orthotopic lung tumor sections.
IHC analysis of tumor sections collected from untreated control, BBR free drug and BBR-SD formulation treated animals. First row of images shows the cleaved caspase-3 expression in different groups. The brown color stained cells indicate the cleaved caspase-3 specific positive cells. Second row shows the CD31 expression, the brown colored cells suggest the MVD positive cells. Third row shows the TUNEL assay, brown color stained cells indicate the apoptotic positive cells.
Figure 8
Figure 8. IHC analysis and VEGF levels.
A) Quantification of cleaved caspase 3, CD31 positive MVD and TUNEL positive cells by IHC analysis. For IHC quantification, 10 fields were randomly counted from each tumor sections and 4 slides per group were used. B) VEGF levels in serum and tumor lysates after treatment with BBR free drug and BBR-SD. Each data point was represented as mean±sem (n = 3–4). *p<0.05 and ***p<0.001 Vs respective untreated control groups.
Figure 9
Figure 9. Histopathological Analysis.
A) H&E stained histopathology of tumor section from orthotopic lung tumor models. B) H&E stained histopathological ileum sections after treatment with BBR free drug and BBR-SD. No visible toxicity was observed in GIT (Ileum). C) Body weights changes during the treatment of BBR free drug and BBR-SD, no significant change in the body weights were observed. Each data point was represented as mean±sem (n = 6–8).
Figure 10
Figure 10. Anticancer effects of BA-SD formulations in orthotopic and metastatic lung cancer models.
A) Lung tumor weights and tumor volumes after treatment with BA free drug and BA-SD formulations in A549 orthotopic and metastatic lung tumor models, B) Number of lung tumor nodules in peripheral, medial and central lobes in A549 metastatic models after treatment with BA free drug and BA-SD formulations. C) Quantification of TUNEL positive cells in orthotopic lung tumors D) Representative TUNEL assay images of orthotopic lung tumor images from control, BA free drug and BA-SD treated groups. Each data point was represented as mean±sem (n = 6–8). **p<0.01 and ***p<0.001 Vs respective untreated control groups.
Figure 11
Figure 11. Real time-PCR analysis and Toxicity evaluation.
A) Expression of p38, Phospho-JNK, Bax, Bcl-2, cleaved casapase-3&8, survivin and BAD in orthotopic lung tumor after treatment with BA free drug and BA-SD by real time PCR. B) Body weight changes during the treatment with BA free drug and BA-SD. C)Representative H&E stain based histopathological analysis of small intestine (jejunum) after treatment with BA free drug and BA-SD formulations. Each data point was represented as mean±sem (n = 6–8). **p<0.01 and ***p<0.001 Vs respective untreated control groups.

References

    1. Mullauer FB, Kessler JH, Medema JP (2010) Betulinic acid, a natural compound with potent anticancer effects. Anticancer Drugs 21: 215–227. - PubMed
    1. Farnsworth NR, Akerele O, Bingel AS, Soejarto DD, Guo Z (1985) Medicinal plants in therapy. Bull World Health Organ 63: 965–981. - PMC - PubMed
    1. Subbaiah TV, Amin AH (1967) Effect of berberine sulphate on Entamoeba histolytica. Nature 215: 527–528. - PubMed
    1. Ho YT, Yang JS, Lu CC, Chiang JH, Li TC, et al. (2009) Berberine inhibits human tongue squamous carcinoma cancer tumor growth in a murine xenograft model. Phytomedicine 16: 887–890. - PubMed
    1. Abd El-Wahab AE, Ghareeb DA, Sarhan EE, Abu-Serie MM, El Demellawy MA (2013) In vitro biological assessment of berberis vulgaris and its active constituent, berberine: antioxidants, anti-acetylcholinesterase, anti-diabetic and anticancer effects. BMC Complement Altern Med 13: 218. - PMC - PubMed

Publication types

MeSH terms