

Developmental pharmacokinetics of piperacillin and tazobactam using plasma and dried blood spots from infants
- PMID: 24614369
- PMCID: PMC3993246
- DOI: 10.1128/AAC.02139-13
Developmental pharmacokinetics of piperacillin and tazobactam using plasma and dried blood spots from infants
Abstract
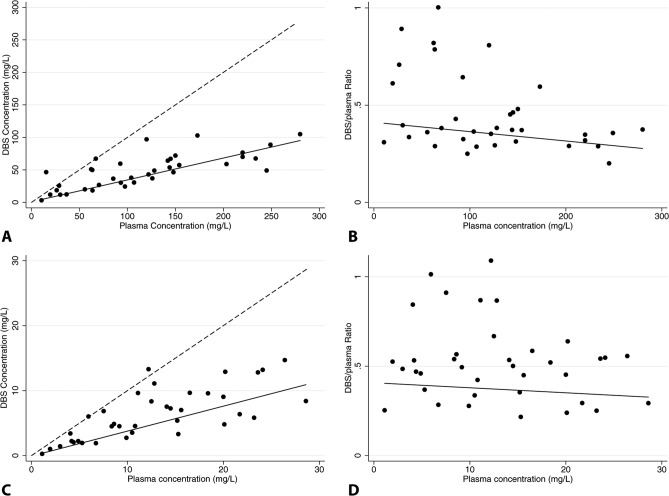
Piperacillin-tazobactam is often given to infants with severe infection in spite of limited pharmacokinetics (PK) data. We evaluated piperacillin-tazobactam PK in premature and term infants of ages <61 days with suspected systemic infection. Infants received intravenous piperacillin-tazobactam (80 to 100 mg/kg of body weight every 8 h [q 8 h]) based on gestational and postnatal age. Sparse plasma samples were obtained after first and multiple doses. Drug concentrations were measured by tandem mass spectrometry. PK data were analyzed using population nonlinear mixed-effect modeling. Target attainment rates for the time unbound piperacillin concentrations remained above the MIC for 50% and 75% of the dosing interval at steady state were evaluated. Bias in population PK parameter estimates was assessed for dried blood spot (DBS) samples, and a comparability analysis was performed for DBS and plasma drug concentrations using linear regression. We obtained 128 plasma samples from 32 infants, median gestational age of 30 weeks (range, 23 to 40 weeks) and postnatal age of 8 days (range, 1 to 60). Piperacillin and tazobactam PK models included body weight (WT) and postmenstrual age (PMA) as covariates for clearance and WT for volume of distribution and were used to optimize dosing in infants. DBS drug concentrations were 50 to 60% lower than those in plasma, but when combined with plasma concentrations and a matrix effect, the data generated PK model parameters similar to those for plasma alone. With PMA-based dosing (100 mg/kg q 8 h, 80 mg/kg q 6 h, and 80 mg/kg q 4 h for PMA of ≤30, 30 to 35, and 35 to 49 weeks, respectively), 90% of simulated infants achieved the surrogate therapeutic target of time above the MIC (≤32 mg/liter) for 75% of the dosing interval.
Figures
References
-
- Vohr BR, Wright LL, Dusick AM, Mele L, Verter J, Steichen JJ, Simon NP, Wilson DC, Broyles S, Bauer CR, Delaney-Black V, Yolton KA, Fleisher BE, Papile LA, Kaplan MD. 2000. Neurodevelopmental and functional outcomes of extremely low birth weight infants in the National Institute of Child Health and Human Development Neonatal Research Network, 1993–1994. Pediatrics 105:1216–1226. 10.1542/peds.105.6.1216 - DOI - PubMed
-
- Yeh TC, Chang JH, Kao HA, Hsu CH, Hung HY, Peng CC. 2004. Necrotizing enterocolitis in infants: clinical outcome and influence on growth and neurodevelopment. J. Formos. Med. Assoc. 103:761–766 - PubMed
-
- Thomson Reuters clinical editorial staff. 2011. Neofax 2011, 24th ed. Thomson Reuters, Montvale, NJ
-
- Tschudy M, Arcara K. 2011. The Harriet Lane handbook: a manual for pediatric house officers, 19th ed, p 1035 Mosby, Philadelphia, PA
Publication types
MeSH terms
Substances
Grants and funding
- U54 HD071600-01/HD/NICHD NIH HHS/United States
- HHSN267200700051C/HD/NICHD NIH HHS/United States
- 1K23HD064814/HD/NICHD NIH HHS/United States
- HHSN275201000003C/HD/NICHD NIH HHS/United States
- UL1 RR024128/RR/NCRR NIH HHS/United States
- UL1TR001117/TR/NCATS NIH HHS/United States
- K23 HD064814/HD/NICHD NIH HHS/United States
- HHSN275201000003I/HD/NICHD NIH HHS/United States
- UL1 TR001117/TR/NCATS NIH HHS/United States
- L40 HD069892/HD/NICHD NIH HHS/United States
- U54 HD071600/HD/NICHD NIH HHS/United States
- 1R01HD057956-05/HD/NICHD NIH HHS/United States
- 1T32GM086330-01A1/GM/NIGMS NIH HHS/United States
- K24 HD058735/HD/NICHD NIH HHS/United States
- R01 HD057956/HD/NICHD NIH HHS/United States
- U01 FD004858/FD/FDA HHS/United States
- T32 GM086330/GM/NIGMS NIH HHS/United States
- 1K24HD058735-05/HD/NICHD NIH HHS/United States
LinkOut - more resources
Full Text Sources
Other Literature Sources
Medical
