. 2014 Mar 11:4:4348.
doi: 10.1038/srep04348.

The plasma protein fibrinogen stabilizes clusters of red blood cells in microcapillary flows

Affiliations

The plasma protein fibrinogen stabilizes clusters of red blood cells in microcapillary flows

M Brust et al. Sci Rep. .

Abstract

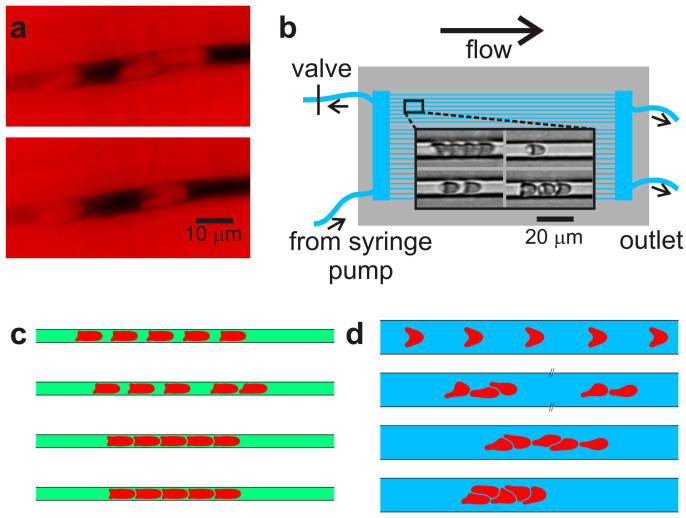
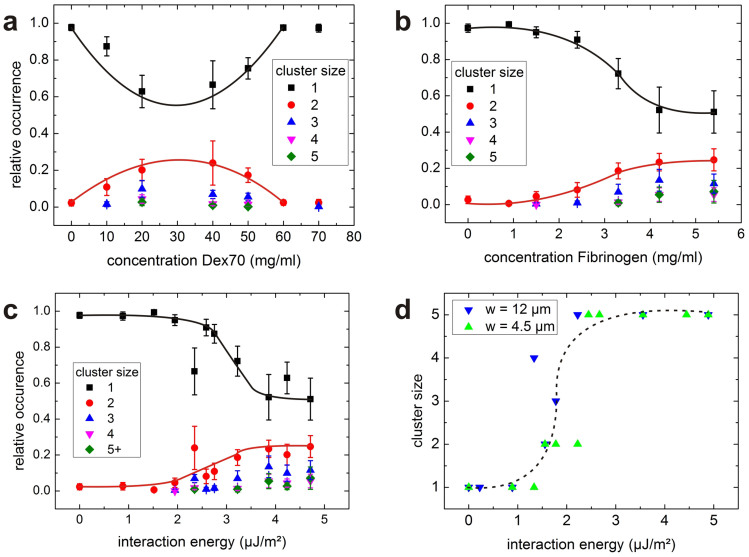
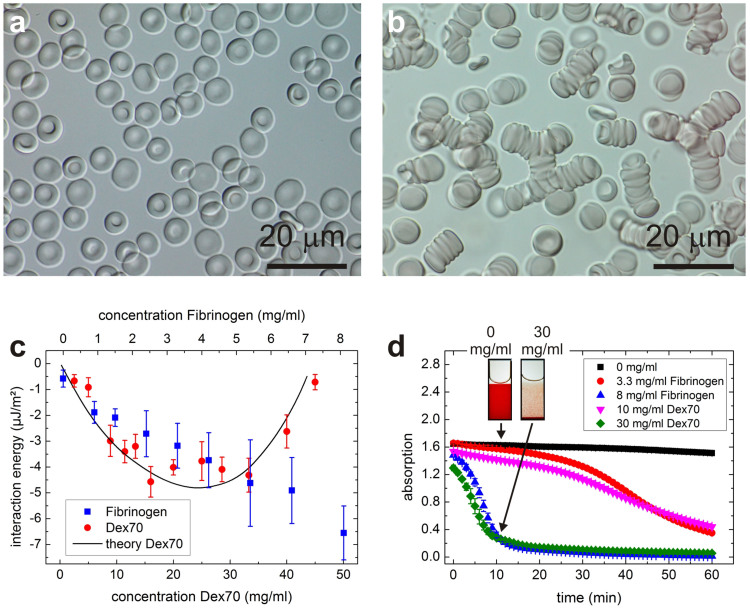
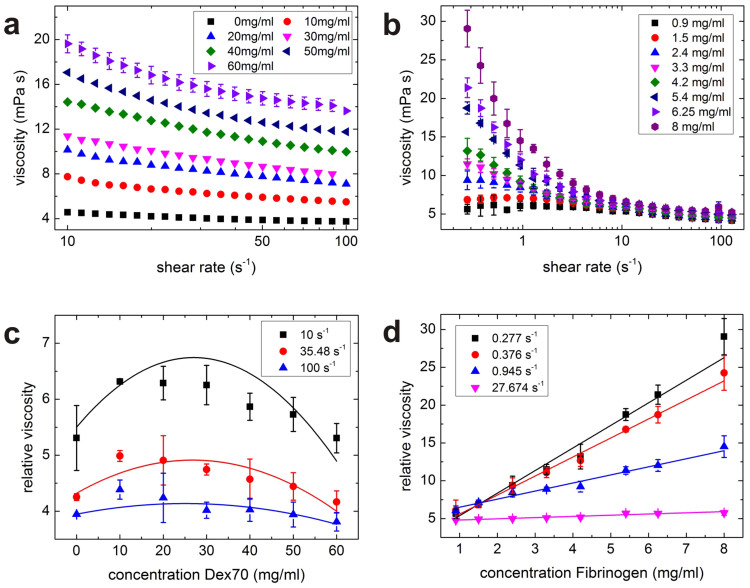
The supply of oxygen and nutrients and the disposal of metabolic waste in the organs depend strongly on how blood, especially red blood cells, flow through the microvascular network. Macromolecular plasma proteins such as fibrinogen cause red blood cells to form large aggregates, called rouleaux, which are usually assumed to be disaggregated in the circulation due to the shear forces present in bulk flow. This leads to the assumption that rouleaux formation is only relevant in the venule network and in arterioles at low shear rates or stasis. Thanks to an excellent agreement between combined experimental and numerical approaches, we show that despite the large shear rates present in microcapillaries, the presence of either fibrinogen or the synthetic polymer dextran leads to an enhanced formation of robust clusters of red blood cells, even at haematocrits as low as 1%. Robust aggregates are shown to exist in microcapillaries even for fibrinogen concentrations within the healthy physiological range. These persistent aggregates should strongly affect cell distribution and blood perfusion in the microvasculature, with putative implications for blood disorders even within apparently asymptomatic subjects.


Figures

Figure 1
Figure 1
(a) A cluster of RBCs (above) and a single RBC (below) passing through a capillary of a mouse (see SM1 for an online video). The RBCs are imaged in a dorsal skinfold chamber using intravital fluorescence microscopy. To enhance the contrast, 0.05 ml 5% fluorescein-isothiocyanate (FITC)-labelled dextran was injected in vivo via the retrobulbary space. The effective dextran concentration in the vascular network is well below any significant effect of aggregation. The images are colourised. (b) A schematic drawing of the microfluidic device and shadowgraph snapshots of clusters of RBCs in the microcapillaries. The microfluidic device includes 30 parallel channels of rectangular cross-section 8.5 μm (width) and 4.5 μm (height). The images are recorded using a high-speed camera, and the flow velocity and distribution of cells flowing through the observed section of the channels are determined (i.e., the numbers of single cells or clusters of different lengths (2, 3, 4, 5 or more cells) are counted). (c) A snapshot of the steady-state numerical results regarding the effect of intercellular surface energy due to fibrinogen on RBC organisation in a channel with a width w = 4.5 μm. From top to bottom: ε = 0, ε = 1.78, ε = 3.56, and ε = 4.89 μJ/m2 correspond to fibrinogen concentrations of 0, 1, 4 (still in the physiological range) and 6.5 mg/ml, respectively. (d) The same as in (c), but a channel of width w = 12 μm was used.
Figure 2
Figure 2
(a) Statistical distribution of differently sized RBC clusters at various dextran concentrations in a microfluidic device. At concentrations of 0 and greater than 60 mg/ml, no clusters were found. At 30 mg/dl, cell aggregation was so severe that clogging of the channels prevented systematic measurements. (b) The same as in (a) but using fibrinogen. Clustering increases with fibrinogen concentration. At concentrations greater than 5.5 mg/ml, the protein could not be fully dissolved; nevertheless, a stronger tendency to form aggregates and clog channels was observed. The lines are drawn as guides for the eye. (c) Statistical distribution of differently sized clusters in the microfluidic device as a function of the interaction energy. (d) Numerical results for the length of clusters at the steady state as a function of intercellular surface energy in channels of various widths.
Figure 3
Figure 3
An image of single RBCs (a) in a buffer solution (b) in rouleaux in a 20 mg/ml dextran solution in a Petri dish. (c) Interaction energies between two RBCs based on single cell force spectroscopy (symbols) and the theoretical data from (line). The experimental data obtained at various concentrations of dextran are from. (d) Absorption measurements at different concentrations of dextran and fibrinogen showing differences in sedimentation speed. A cuvette is filled with a suspension of washed RBCs at a density of 45 vol% (haematocrit) with various concentrations of dextran or fibrinogen. The beam from the UV-Vis spectrometer is aligned 3 mm below the meniscus. When the RBCs sediment, the opacity of the suspension decreases. Inset: Images of the cuvettes at 0 and 30 mg/ml dextran 11 minutes after filling. Aggregation of the cells leads to more rapid sedimentation.
Figure 4
Figure 4
(a) Bulk viscosity of RBC suspensions at 45% haematocrit as a function of shear rate for various dextran concentrations. Error bars are only shown for the highest dextran concentration (b) the same as (a) but for different concentrations of fibrinogen. In both cases, the viscosity at low shear rates and the effect of shear thinning increases with macromolecule concentration. The viscosity of the solvent increases strongly with dextran concentration but is independent of fibrinogen concentration within the instrumental resolution. To separate the effect of aggregation in (c) and (d), the relative viscosity (the ratio of the viscosity of the RBC suspension and the viscosity of the solvent with dextran or fibrinogen only) is shown. Lines are drawn as guides for the eye.

References

    1. Fahraeus R. The Influence of the rouleau formation of the erythrocytes on the rheology of the blood. Acta Med. Scand. 161, 151–165 (1958). - PubMed
    1. Merrill E. W., Cokelet G. C., Britten A. & Wells R. E. Non-Newtonian rheology of human blood - effect of fibrinogen deduced by “subtraction”. Circ Res. 13, 48–55 (1963). - PubMed
    1. Popel A. S. & Johnson P. C. Microcirculation and hemorheology. Annu. Rev. Fluid Mech. 37, 43–69 (2005). - PMC - PubMed
    1. Bishop J. J., Popel A. S., Intaglietta M. & Johnson P. C. Rheological effects of red blood cell aggregation in the venous network: A review of recent studies. Biorheology 38, 263–274 (2001). - PubMed
    1. Marton Zs., Kesmarky G., Vekasi J., Cser A., Russai R., Horvath B. & Toth K. Red blood cell aggregation measurements in whole blood and in fibrinogen solutions by different methods. Clin. Hemorheol. Micro. 24, 75–83 (2001). - PubMed

Publication types