. 2014 Mar 17;204(6):1027-44.
doi: 10.1083/jcb.201306147. Epub 2014 Mar 10.

Bleb-driven chemotaxis of Dictyostelium cells

Affiliations

Bleb-driven chemotaxis of Dictyostelium cells

Evgeny Zatulovskiy et al. J Cell Biol. .

Abstract

Blebs and F-actin-driven pseudopods are alternative ways of extending the leading edge of migrating cells. We show that Dictyostelium cells switch from using predominantly pseudopods to blebs when migrating under agarose overlays of increasing stiffness. Blebs expand faster than pseudopods leaving behind F-actin scars, but are less persistent. Blebbing cells are strongly chemotactic to cyclic-AMP, producing nearly all of their blebs up-gradient. When cells re-orientate to a needle releasing cyclic-AMP, they stereotypically produce first microspikes, then blebs and pseudopods only later. Genetically, blebbing requires myosin-II and increases when actin polymerization or cortical function is impaired. Cyclic-AMP induces transient blebbing independently of much of the known chemotactic signal transduction machinery, but involving PI3-kinase and downstream PH domain proteins, CRAC and PhdA. Impairment of this PI3-kinase pathway results in slow movement under agarose and cells that produce few blebs, though actin polymerization appears unaffected. We propose that mechanical resistance induces bleb-driven movement in Dictyostelium, which is chemotactic and controlled through PI3-kinase.


Figures
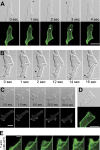
Figure 1.
Figure 1.
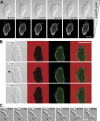
Blebs formed by Dictyostelium cells moving under buffer. (A) Blebs (black dots) formed at the leading edge of a cell expressing an F-actin reporter. Blebs are small and expand in less than one second, leaving behind an F-actin scar (white arrows), but rapidly regain an F-actin cortex (see Video 1). (B) The cell leading a small stream moving in bleb mode (see Video 3). (C) Transformation of a bleb (arrowed) into a pseudopod by continued actin polymerization. (D) A composite bleb and pseudopod (“blebbopodium”). (E) Detail of the transformation of a bleb into a pseudopod by continued actin polymerization (see Video 2). Ax2 cells expressing the F-actin reporter ABD120-GFP were starved for 5.5 h, or 6.5 h for B. Confocal fluorescence and DIC images obtained at 1 frame per second; Bars: (A, B, and D) 10 µm; (E) 1 µm.
Figure 2.
Figure 2.
Bleb-driven movement is induced by mechanical resistance. (A) Mechanical resistance provided by an overlay of 0.7% agarose induces a cell to move entirely in bleb mode. Blebs (dots) leave behind their cortical F-actin as a scar when they expand (see Video 4). (B) Blebs produced by a cell moving under a 0.7% agarose overlay containing fluorescent dye (0.5 mg/ml RITC-dextran) to reveal its outline. A bleb (dot) expands in less than 0.5 s, leaving behind an F-actin scar; it initially lacks an F-actin cortex, but rebuilds one in another second (see Video 6). (C) Cells embedded in 0.5% low melting-point agarose produce copious blebs. Ax2 cells used throughout, and expressing the F-actin reporter ABD-GFP in A and B. Bar, 10 µm.
Figure 3.
Figure 3.
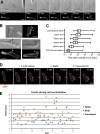
Parameters regulating bleb-driven movement. (A) Blebbing increases as cells prepare for multicellular development. Bleb frequency was measured after different times of starvation (with cyclic-AMP pulsing) in cells randomly moving under buffer, or after addition of 1 µM cyclic-AMP; results are the mean of three separate experiments, in each of which 40–80 cells were analyzed at each time-point. (B) Blebbing increases as the concentration of agarose in the overlay is increased. Blebs given as percentage of total projections (blebs + pseudopods). (C) Decreasing cell height with increasing agarose concentration in the overlay, as determined from confocal images (see Video 5 for reconstructions of cells at different agarose concentrations and for the movement of fluorescent beads in the agarose as cells pass). (D) Dependence of Young’s modulus on the agarose concentration. Agarose elasticity modulus was measured by indentation with a spherical tip at 0.06 mm/s; average of three replicates for each concentration. Ax2 cells expressing the F-actin reporter ABD-GFP, to help bleb identification, were used throughout.
Figure 4.
Figure 4.
Dynamics of blebs and pseudopods. (A) Space-time plots comparing F-actin dynamics in a pseudopod and a bleb. Pseudopods are marked by a continuous, steady advance of F-actin at the leading edge, in contrast to the discontinuous advance in blebs. (B and C) Blebs are distinguished from pseudopods by their greater maximum speed of expansion, loss of F-actin at the membrane during expansion, and lower displacement achieved over their lifetime. For C, a set of 12 Ax2 cells expressing ABD-GFP and starved for 5–6 h was observed by spinning-disc confocal microscopy at 4.5 frames per second and analyzed by modified QuimP10 software (37 blebs; 88 pseudopods); loss of F-actin (B) was measured in manually identified projections from these same cells (12 blebs; 22 pseudopods). Each data-point represents a single bleb or pseudopod.
Figure 5.
Figure 5.
Blebs are orientated by chemotactic gradients. (A) Orientation of blebs and F-actin–driven pseudopods in cells chemotaxing toward cyclic-AMP under 0.7% agarose. Blebs and pseudopods were identified by eye (144 blebs; 304 pseudopods). (B) Orientation of all projections with a maximum speed >1.5 µm/s, equating largely to blebs, as determined using modified QuimP10 software. Both blebs and pseudopods orientate with the chemotactic gradient, but the bimodal distribution of blebs is significantly different from the distribution of pseudopods, as shown by the following statistical tests: number of blebs formed from the front and rear halves of the cell is the same, binomial distribution test: P < 10−15; distribution of blebs and pseudopods is the same, circular Kuiper two-sample test: P < 0.001; unimodality of distribution, Hartigan’s dip test (Hartigan and Hartigan, 1985): P = 0.002 for blebs and P = 0.992 for pseudopods; preference of pseudopods to appear at the front of the cell compared with the blebs’ preference for the side, Fisher’s exact test: P < 10−15. Ax2 cells expressing the F-actin reporter ABD-GFP were used.
Figure 6.
Figure 6.
Blebs rapidly re-orientate in cells chasing a micropipette releasing cyclic-AMP. (A) Illustration of re-orientation experiment: a cell is attracted toward a needle releasing cyclic-AMP until it becomes elongated, then the needle is moved to the flank, inducing a turn. This cell follows the stereotypic pathway by first producing F-actin microspikes facing the needle (12 s), then a bleb (19 s; dot), and finally a pseudopod (32 s). (B) Examples of blebs produced during chemotactic re-orientation (see Video 7 for a selection of turning events). (C) Timing of events during re-orientation; mean and range are shown. (D) Illustration of the stereotypic sequence of events when a cell re-orientates through a new projection on its flank. Microspikes are apparent after 8 s, then at 9 s a bleb forms (single yellow arrow) and together with a second bleb, transforms into a pseudopod (double yellow arrows). (E) Behavior of 30 individual cells during re-orientation. This represents the same set of cells as in C. Only turns where the cells produce a new leading edge from their flank were analyzed. Ax2 cells were starved for ∼5.5 h and express ABD-GFP, except for the cells used for PIP3 accumulation in C, which expressed CRAC-PH-GFP. Bar, 10 μm.
Figure 7.
Figure 7.
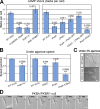
Myosin-II mutants do not bleb and their movement under an agarose overlay is impaired. (A) Cells of the parental strain, JH10, and a null mutant of myosin essential light chain (MlcE) under 1% agarose. The parental strain produces blebs (arrows), the mutant does not. (B) MlcE-null cells do not produce high-speed projections (>1.5 µm/s, equated to blebs) under a 0.7% agarose overlay (six cells analyzed using QuimP10). (C) Myosin-II null mutants move more slowly under 0.7% agarose overlays than wild-type (JH10: wild-type; MlcE: myosin essential light chain; MlcR: myosin regulatory light chain; MhcA: myosin heavy chain). (D) Myosin-null mutants do not bleb in response to uniform cyclic-AMP stimulation. Cyclic-AMP shock assay: cells under buffer were stimulated with 1 µM cyclic-AMP, and blebs counted manually (see Video 8). Under agarose migration speed: speed of cells moving under 0.7% agarose toward a well of 4 µM cyclic-AMP was measured. Bar, 10 µm.
Figure 8.
Figure 8.
Blebbing and movement under an agarose overlay are regulated by PI3-kinase and its downstream effectors, CRAC and PhdA. (A) Blebbing in response to cyclic-AMP is severely impaired when PI3-kinase activity is inhibited, either in a mutant lacking five PI3-kinases (PI3K1–5) or by adding the PI3-kinase inhibitor, LY294002, to Ax2 cells. Blebbing in mutants of downstream PIP3-binding proteins is unimpaired in PKB/PKBR1 double-null cells, but significantly impaired in CRAC and PhdA cells, where it can be substantially rescued by re-expression of the corresponding GFP fusion protein. A double CRAC/PhdA-null mutant blebs very poorly. (B) Movement speed is reduced under 0.7% agarose overlays in PI3-kinase, CRAC, and PhdA mutants. (C) Wild-type and PI3-kinase quintuple knock-out cells under 2% agarose. (D) PKB/PKBR1 double-mutant cell produces a bleb (dot) in a re-orientation experiment performed as in Fig. 6, and providing evidence that blebbing is unimpaired in this mutant. Cyclic-AMP shock assay: cells were stimulated with 1 µM cyclic-AMP, and blebs counted manually. Under agarose migration speed: the speed of cells moving under 0.7% agarose toward a well containing 4 µM cyclic-AMP was measured. Bar, 10 µm.
Figure 9.
Figure 9.
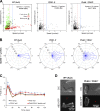
Protrusions made by cells impaired in PI3-kinase signaling. (A) Blebbing is impaired in mutant cells chemotaxing under 0.7% agarose. Analysis with QuimP10 shows that the mutants are deficient in forming high-speed projections, which we equate to blebs (cells analyzed: Ax2 = 30; PI3K1–5 = 19; CRAC/PhdA = 19). Projections made by the wild type were further classified by eye as pseudopods or blebs (green and red) or various hybrids and unidentified (other marks). (B) Chemotactic orientation of low-speed projections (<1 µm/s, equated to pseudopods) of cells moving under 0.7% agarose. It is apparent that pseudopods are projected less accurately by the mutants (projections analyzed: Ax2 = 374; PI3K1–5 = 257; CRAC/PhdA = 416). (C) Actin polymerization after acute stimulation of cells with cyclic-AMP. The PhdA and CRAC mutants show a robust fast response (peak before 10 s), similar to the wild type. (D) Formation of F-actin microspikes during turning toward a micropipette releasing cyclic-AMP (red asterisks). Microspikes form in the same time-scale as the first peak of actin polymerization in C and are made by the PhdA/CRAC double mutant as well as the wild type. In A and B, projections by cells moving under 0.7% agarose were identified automatically using modified QuimP10 software and their maximum speed, total displacement, and orientation determined.
Figure 10.
Figure 10.
PIP3, F-actin structures, and blebs during re-orientation of wild-type and PhdA/CRAC double-null cells. (A) Re-orientation of a wild-type cell. PIP3 accumulates at the membrane adjacent to the cyclic-AMP micropipette within 5 s of the micropipette movement, and F-actin microspikes form at the same time. At 14 s after the move a substantial bleb forms from the region of the membrane with highest PIP3 accumulation (see Video 9). (B) Re-orientation of a PhdA/CRAC double-mutant cell. These cells are generally less elongated than the wild type, but can still turn by forming a new leading edge from their flank. Although a PIP3 patch and F-actin microspikes form normally, the cell does not turn with a bleb, but uses a pseudopod instead (see Video 10). Turning experiments, using a micropipette filled with cyclic-AMP, were performed as in Fig. 6 with wild-type and HM1589 cells expressing PH-CRAC-GFP and LifeAct-RFP, and starved for 5.5 h.

References

    1. Andrew N., Insall R.H. 2007. Chemotaxis in shallow gradients is mediated independently of PtdIns 3-kinase by biased choices between random protrusions. Nat. Cell Biol. 9:193–200 10.1038/ncb1536 - DOI - PubMed
    1. Arrieumerlou C., Meyer T. 2005. A local coupling model and compass parameter for eukaryotic chemotaxis. Dev. Cell. 8:215–227 10.1016/j.devcel.2004.12.007 - DOI - PubMed
    1. Bergert M., Chandradoss S.D., Desai R.A., Paluch E. 2012. Cell mechanics control rapid transitions between blebs and lamellipodia during migration. Proc. Natl. Acad. Sci. USA. 109:14434–14439 10.1073/pnas.1207968109 - DOI - PMC - PubMed
    1. Blagg S.L., Stewart M., Sambles C., Insall R.H. 2003. PIR121 regulates pseudopod dynamics and SCAR activity in Dictyostelium. Curr. Biol. 13:1480–1487 10.1016/S0960-9822(03)00580-3 - DOI - PubMed
    1. Blaser H., Reichman-Fried M., Castanon I., Dumstrei K., Marlow F.L., Kawakami K., Solnica-Krezel L., Heisenberg C.P., Raz E. 2006. Migration of zebrafish primordial germ cells: a role for myosin contraction and cytoplasmic flow. Dev. Cell. 11:613–627 10.1016/j.devcel.2006.09.023 - DOI - PubMed

Publication types

MeSH terms