. 2014 Apr 7;211(4):605-12.
doi: 10.1084/jem.20131033. Epub 2014 Mar 10.

Csnk1a1 inhibition has p53-dependent therapeutic efficacy in acute myeloid leukemia

Affiliations

Csnk1a1 inhibition has p53-dependent therapeutic efficacy in acute myeloid leukemia

Marcus Järås et al. J Exp Med. .

Abstract

Despite extensive insights into the underlying genetics and biology of acute myeloid leukemia (AML), overall survival remains poor and new therapies are needed. We found that casein kinase 1 α (Csnk1a1), a serine-threonine kinase, is essential for AML cell survival in vivo. Normal hematopoietic stem and progenitor cells (HSPCs) were relatively less affected by shRNA-mediated knockdown of Csnk1a1. To identify downstream mediators of Csnk1a1 critical for leukemia cells, we performed an in vivo pooled shRNA screen and gene expression profiling. We found that Csnk1a1 knockdown results in decreased Rps6 phosphorylation, increased p53 activity, and myeloid differentiation. Consistent with these observations, p53-null leukemias were insensitive to Csnk1a1 knockdown. We further evaluated whether D4476, a casein kinase 1 inhibitor, would exhibit selective antileukemic effects. Treatment of leukemia stem cells (LSCs) with D4476 showed highly selective killing of LSCs over normal HSPCs. In summary, these findings demonstrate that Csnk1a1 inhibition causes reduced Rps6 phosphorylation and activation of p53, resulting in selective elimination of leukemia cells, revealing Csnk1a1 as a potential therapeutic target for the treatment of AML.


Figures

Figure 1.
Figure 1.
Silencing of Csnk1a1 selectively depletes mouse leukemia cells in a kinase-dependent manner. (A) TaqMan-PCR was used to assess Csnk1a1 transcript levels in Csnk1a1 shRNA 1–3 (Csnk1a1-sh1-3)–expressing mouse leukemia cells. Csnk1a1 levels are presented as the percentage of transcript remaining relative to the luciferase control shRNA (Control-sh)–expressing cells (n = 3). (B) Western blot demonstrating Csnk1a1 protein levels in shRNA-expressing leukemia cells together with Actin as endogenous control. (C) c-Kithigh dsRed+ leukemia cells were transduced with lentiviral vectors coexpressing GFP and shRNAs targeting Csnk1a1 and then transplanted via the tail vein into wild-type mice. The percentage of GFP+ cells within dsRed+ population was assessed before injection (input) and in mice BM and spleen 13 d after transplant. Data are presented as the GFP percentage normalized to the input measurement (three mice per group; each mouse was injected with leukemia cells from independent transductions). (D) BM homing experiment in which the percentage of GFP+ leukemia cells in the BM 24 h after transplantation was compared with corresponding in vitro cultured cells (five mice per group; each mouse was injected with leukemia cells from independent transductions). (E) After being transplanted with CD45.2 LSK cells transduced with lentiviral vectors coexpressing GFP and shRNAs targeting Csnk1a1, recipient mice were assessed for the percentage of GFP+ cells within the CD45.2 population in the peripheral blood for 24 wk (at least five mice per group; each mouse injected with leukemia cells from independent transductions). The GFP percentage was normalized to the input measurement. (F) Csnk1a1 rescue experiment in which leukemia cells were transduced with both puromycin-resistant lentiviral shRNA vectors and retroviral vectors coexpressing GFP only (control), shRNA-resistant Csnk1a1 wild-type cDNA (Csnk1a1), or a kinase-dead Csnk1a1 cDNA (Csnk1a1(D136N)). Csnk1a1 rescue is presented as the ratio between the percentage of GFP-positive cells within Csnk1a1-sh1– versus Control-sh–expressing cells at day 6 after lentiviral transduction. (G) 100,000 sorted GFP+ leukemia cells carrying shRNAs were transplanted into wild-type recipient mice. Survival of the mice is shown in Kaplan–Meier curves (at least six mice per group; each mouse was injected with leukemia cells from independent transductions). Means and SD are shown (*, P < 0.05; **, P < 0.01; ***, P < 0.001).
Figure 2.
Figure 2.
Csnk1a1 suppression leads to dramatic reduction in Rps6 phosphorylation. (A) Genes targeted by two or more shRNAs that depleted leukemia cells >40-fold in the BM and spleen (n = 5). (B) Graphs showing fold change of all shRNAs included in the screen. Rps6 was identified as a strong hit with three separate shRNAs (Rps6-sh1–3) all depleting leukemia cells >40-fold in the BM and spleen after 14 d in vivo relative to input (same experiment as in A). Dashed lines depict 40-fold depletion. (C) TaqMan-PCR was used to assess Rps6 transcript levels in shRNA-expressing leukemia cells. Rps6 levels are presented as the percentage of transcript remaining relative to Control-sh–expressing cells (n = 3). (D) Western blot demonstrating Rps6 protein levels and Rps6 phosphorylation in shRNA-expressing mouse leukemia cells together with Actin as endogenous control. (E) Rps6 rescue experiment in which leukemia cells were transduced with both puromycin-resistant lentiviral shRNA vectors and retroviral vectors coexpressing GFP only (Control), Rps6 cDNA, or a Rps6-S5D (phosphomimetic mutant) cDNA (n = 3). Rps6 rescue is presented as the ratio between the percentage of GFP-positive cells within Csnk1a1-sh1 versus Control-sh–expressing cells. Means and SD are shown (*, P < 0.05).
Figure 3.
Figure 3.
Csnk1a1 suppression activates a p53 response. (A) In leukemia cells with shRNA-mediated suppression of Csnk1a1, p53 signatures are enriched by GSEA. (B) Western blot demonstrating induced p53 and p21 expression after shRNA-mediated silencing of Csnk1a1 in leukemia cells. Actin was used as an endogenous control. (C) In leukemia cells with Csnk1a1 suppressed, up-regulated genes were enriched in a myeloid differentiation signature (left), and down-regulated genes were enriched in a hematopoietic stem cell (HSC) versus GMP down signature, i.e., a signature of genes down-regulated in GMPs relative to HSCs. (D) Histogram depicting c-Kit expression 72 h after transductions with shRNA-expressing lentiviral vectors. (E) MLL-AF9 leukemia cells in Tp53−/− and Tp53+/+ background were transduced with vectors coexpressing GFP and Control-sh or Csnk1a1-sh1. The GFP percentage was measured 2 (input) and 7 d after transduction. Data are presented as the GFP percentage normalized to the input measurement (n = 3). (F) 200,000 sorted GFP+ Tp53−/− leukemia cells carrying Control-sh or Csnk1a1-sh1 were transplanted into wild-type recipient mice. Survival of the mice is shown in Kaplan–Meier curves (six mice per group; each mouse was injected with leukemia cells from independent transductions). (G) Leukemia cells carrying shRNAs were analyzed for early (Annexin V+ Hoechst 33342) and late (Annexin V+ Hoechst 33342+) apoptotic cells (n = 3). (H) Cell cycle analysis on leukemia cells carrying shRNAs (n = 3). Means and SD are shown (**, P < 0.01; ***, P < 0.001).
Figure 4.
Figure 4.
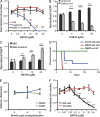
Small molecule inhibition of Csnk1a1 selectively kills leukemia cells. (A) Normal LSK, Tp53−/−, and Tp53+/+ c-Kithigh leukemia cells were treated in medium supplemented with increasing doses of D4476, and cell number was assessed after 4 d. Data are presented as the cell count normalized to the DMSO control (n = 3). Black asterisks depict significance between Tp53+/+ leukemia and Tp53−/− leukemia comparison, and red asterisks depict significance between LSK and Tp53+/+ leukemia cell comparison. (B) c-Kithigh leukemia cells were transduced with vectors coexpressing shRNAs and GFP and then treated with D4476 for 4 d. Data are presented as the percentage of GFP+ cells after treatment normalized to the DMSO control (n = 3). (C) c-Kithigh leukemia cells were transduced with a vector coexpressing Csnk1a1 and GFP and then treated with D4476 for 4 d. Data are presented as the percentage of GFP+ cells after treatment normalized to the DMSO control (n = 3). (D) 10,000 LSK cells (CD45.1+) and 10,000 c-Kithigh leukemia cells (dsRed+) were co-cultured on GFP-positive mouse mesenchymal stroma cells for 48 h in the presence of 40 µM D4476 (6 mice; each mouse was injected with cells from independent drug treatments) or DMSO control (10 mice; each mouse was injected with cells from independent drug treatments) and then transplanted into CD45.2+ recipients along with CD45.1+CD45.2+ competitor cells. The green line depicts the group with LSK-treated cells only, i.e., no leukemia cells were added to the wells (four mice; each mouse was injected with cells from independent drug treatments). Survival is shown in Kaplan–Meier curves. (E) Repopulation of donor cells in peripheral blood was determined as the percentage of donor (CD45.1+CD45.2) cells among the donor and competitor cells after subtracting the leukemia (dsRed+) cell population (same experiment as in D). The green line depicts the group with LSK-treated cells only, and the blue line depicts the group with D4476-treated mixed c-Kithigh leukemia and LSK cells. Flow cytometric analysis was performed at 4, 8, and 16 wk. (F) M9 leukemia cells and cord blood (CB) CD34+ cells were cultured in medium supplemented with increasing doses of D4476, and cell number was assessed after 4 d. Data are presented as the cell count normalized to DMSO control (n = 3). Means and SD are shown (*, P < 0.05; **, P < 0.01; ***, P < 0.001).

References

    1. Anastassiadis T., Deacon S.W., Devarajan K., Ma H., Peterson J.R. 2011. Comprehensive assay of kinase catalytic activity reveals features of kinase inhibitor selectivity. Nat. Biotechnol. 29:1039–1045 10.1038/nbt.2017 - DOI - PMC - PubMed
    1. Barabé F., Kennedy J.A., Hope K.J., Dick J.E. 2007. Modeling the initiation and progression of human acute leukemia in mice. Science. 316:600–604 10.1126/science.1139851 - DOI - PubMed
    1. Bidère N., Ngo V.N., Lee J., Collins C., Zheng L., Wan F., Davis R.E., Lenz G., Anderson D.E., Arnoult D., et al. 2009. Casein kinase 1α governs antigen-receptor-induced NF-κB activation and human lymphoma cell survival. Nature. 458:92–96 10.1038/nature07613 - DOI - PMC - PubMed
    1. Chen L., Li C., Pan Y., Chen J. 2005. Regulation of p53-MDMX interaction by casein kinase 1 alpha. Mol. Cell. Biol. 25:6509–6520 10.1128/MCB.25.15.6509-6520.2005 - DOI - PMC - PubMed
    1. Damalas A., Kahan S., Shtutman M., Ben-Ze’ev A., Oren M. 2001. Deregulated β-catenin induces a p53- and ARF-dependent growth arrest and cooperates with Ras in transformation. EMBO J. 20:4912–4922 10.1093/emboj/20.17.4912 - DOI - PMC - PubMed

Publication types

MeSH terms