. 2014 Apr 15;192(8):3626-36.
doi: 10.4049/jimmunol.1302062. Epub 2014 Mar 10.

Metabolic reprogramming is required for antibody production that is suppressed in anergic but exaggerated in chronically BAFF-exposed B cells

Affiliations

Metabolic reprogramming is required for antibody production that is suppressed in anergic but exaggerated in chronically BAFF-exposed B cells

Alfredo Caro-Maldonado et al. J Immunol. .

Abstract

B cell activation leads to proliferation and Ab production that can protect from pathogens or promote autoimmunity. Regulation of cell metabolism is essential to support the demands of lymphocyte growth and effector function and may regulate tolerance. In this study, we tested the regulation and role of glucose uptake and metabolism in the proliferation and Ab production of control, anergic, and autoimmune-prone B cells. Control B cells had a balanced increase in lactate production and oxygen consumption following activation, with proportionally increased glucose transporter Glut1 expression and mitochondrial mass upon either LPS or BCR stimulation. This contrasted with metabolic reprogramming of T cells, which had lower glycolytic flux when resting but disproportionately increased this pathway upon activation. Importantly, tolerance greatly affected B cell metabolic reprogramming. Anergic B cells remained metabolically quiescent, with only a modest increase in glycolysis and oxygen consumption with LPS stimulation. B cells chronically stimulated with elevated BAFF, however, rapidly increased glycolysis and Ab production upon stimulation. Induction of glycolysis was critical for Ab production, as glycolytic inhibition with the pyruvate dehydrogenase kinase inhibitor dichloroacetate sharply suppressed B cell proliferation and Ab secretion in vitro and in vivo. Furthermore, B cell-specific deletion of Glut1 led to reduced B cell numbers and impaired Ab production in vivo. Together, these data show that activated B cells require Glut1-dependent metabolic reprogramming to support proliferation and Ab production that is distinct from T cells and that this glycolytic reprogramming is regulated in tolerance.


Figures

Figure 1
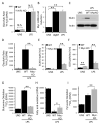
Figure 1. B cells undergo broad metabolic reprogramming upon activation
A, B. Purified B cells were examined after 6 hours culture without stimulation (UNS) or with LPS, and Extracellular Acidification Rate (ECAR) was determined by extracellular flux analysis. (A) Representative plot of ECAR over time of B cells with addition of glucose (10 mM), oligomycin (1 μM), and 2-DG (20 mM) as indicated. (B) Basal glycolysis was determined after addition of glucose and glycolytic capacity was calculated after addition of oligomycin. C, D. Purified B cells were cultured 24 hours in BAFF (20 ng/ml) to maintain viability (unstimulated; UNS) or stimulated with LPS and (C) glycolytic rate and (D) glucose oxidation were directly calculated using radiolabeled glucose. E, F. Purified B cells were examined after 6 hours culture without stimulation (UNS) or with LPS, and Oxygen Consumption Rate (OCR) was determined by extracellular flux analysis. (E) Representative plot of OCR over time with addition of oligomycin (1 μM), mitochondrial uncoupler FCCP (0.5μM), and electron transport inhibitors antimycin (1.5μM) + rotenone (0.75μM) as indicated. (F) Basal OCR was determined prior to addition of oligomycin and Maximal Respiratory Capacity was determined by subtracting non-mitochondrial OCR, calculated after antimycin and rotenone injection to maximal OCR upon FCCP uncoupling and maximal electron transport. G. The ratio of basal OCR/ECAR was determined in purified unstimulated and LPS treated B cells. Values from 24 hours stimulation are normalized to unstimulated cells. B-D, F-G show means from 3 or more independent experiments. Means and standard deviations are shown and statistical significance was determined by Student’s T test (* p≤0.05, ** p<0.005, N.S. not significant).
Figure 2
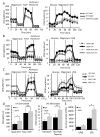
Figure 2. B cells and T cells are metabolically distinct
A-C. Purified B cells and T cells were examined by extracellular flux analysis without stimulation (UNS) or after 24 hours stimulation with anti-IgM or anti-CD3+anti-CD28. (A) OCR, (B) ECAR and (C) OCR/ECAR were measured by extracellular flux analysis. Data are representative of 3 independent experiments. Means and standard deviations are shown and statistical significance was determined by Student’s T test (* p≤0.05, ** p<0.005, N.S. not significant). All experiments were repeated two or more times.
Figure 3
Figure 3. B cell stimulation increases both Glut1 and mitochondrial mass
A-C. Purified B cells were cultured without stimulation, with anti-IgM, or with LPS and (A) glucose uptake in purified mouse or human B cells (panel left and right respectively) was measured using radiolabeled glucose, (B) Glut1 mRNA in murine B cells was measured by quantitative rt-PCR, and (C) Glut1 protein levels in murine B cells were determined by intracellular flow cytometry. D. Purified murine B cells were cultured without stimulation or with LPS for 6 hours and stained with Mitotracker Green to measure mitochondrial mass by flow cytometry. Representative data from 3 or more experiments are shown for A, C, and D. The average of three independent experiments is shown in B. Means and standard deviations are shown and statistical significance was determined by Student’s T test (* p≤0.05, ** p<0.005).
Figure 4
Figure 4. Metabolic reprogramming of B cells requires cMyc but not HIF1α
A. Control (WT) and HIF1α-deficient (HIF1αfl/fl/ROSA26CreERT2 tamoxifen treated in vivo prior to isolation; HIF1α-KO) B cells were unstimulated (UNS) or cultured in LPS for 36 hours and glycolytic flux was measured using radiolabeled glucose. B. Fold induction of cMyc was determined by quantitative rtPCR in unstimulated (UNS) or B cells activated with anti-IgM or LPS for 24 hours. C-I. Control (WT) and cMyc-deficient (cMycfl/fl/ROSA26CreERT2 tamoxifen treated in vivo prior to isolation; Myc-KO) B cells were unstimulated (UNS) or cultured with LPS for 36 hours and analyzed by (C) immunoblot, (D) to measure glycolytic flux, (E) ECAR, (F) OCR, (G) glutamine oxidation, (H) fatty acid oxidation, and (I) pyruvate oxidation were directly measured using radiolabeled substrates. Means and standard deviations are shown and statistical significance was determined by Student’s T test (* p≤0.05, ** p<0.005, N.S. not significant). All experiments were repeated two or more times.
Figure 5
Figure 5. Anergic B cells are metabolically suppressed while BAFF transgenic B cells are primed for metabolic reprogramming
A, B. Purified B cells from control (WT), MD4-transgenic, or MD4 ML5-double transgenic mice were cultured without stimulation or were stimulated with (A) anti-IgM or (B) LPS for 6 hours. Representative plots are shown on left of B cell OCR over time with addition of oligomycin (1 μM), mitochondrial uncoupler FCCP (0.5 μM), and electron transport inhibitors antimycin A (1.5μM) + rotenone (0.75μM) as indicated. Representative plots are shown on right of B cell ECAR over time with addition of glucose (10 mM), oligomycin (1 μM), and 2DG (20 mM) as indicated. C, D. Purified B cells from control (WT) or BAFF-transgenic mice were cultured without stimulation (UNS) or with LPS for 6 hours. Metabolic inhibitors were added during the assays as indicated. (C) Representative plots of B cell OCR (left) and ECAR (right) are shown. (D) Basal and maximal OCR and ECAR from B cells from control and BAFF-transgenic mice stimulated with LPS for 6 hours. E. Glucose uptake of B cells cultured without stimulation or with LPS for 24 hours measured using radiolabeled glucose. Means and standard deviations are shown and statistical significance was determined by Student’s T test (* p≤0.05, ** p<0.005, N.S. not significant). Data are representative of 3 or more experiments.
Figure 6
Figure 6. Chronic BAFF overexposure leads to a glycolytic shift upon activation not observed in normal or tolerant B cells
Purified B cells from wild type control (WT), BAFF-transgenic, and MD4 ML5 transgenic mice were LPS stimulated and OCR and ECAR were measured. The ratios of OCR/ECAR were normalized to unstimulated B cells (UNS) after 6, 12, and 24 hours. Data shown are means from 3 or more independent experiments and statistical significance was determined by Student’s T test (** p≤0.005, N.S. not significant).
Figure 7
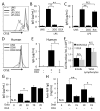
Figure 7. B cells rely on sustained glycolytic flux to proliferate and produce antibody
A, B, C. Purified murine B cells were labeled with CFSE and cultured in BAFF alone to maintain viability or stimulated with LPS in control media or with addition of 2DG (0.5mM), DCA (10mM), or rotenone (Rot; 80 nM) as indicated for (A) flow cytometry and ELISA for (B) IgG and (C) IgM secretion after 3 days. D, E. Purified human peripheral blood B cells were CFSE labeled and cultured without stimulation or stimulated with the TLR9 ligand unmethylated CpG oligonucleotide ODN (2μg/ml) for (D) flow cytometry and (E) ELISA for IgG secretion after 3 days. F, G. Normal bone marrow was transplanted into lethally irradiated Rag1−/− mice that were provided normal (non DCA, n=5) or DCA (n=5) drinking water. (F) B cell and total cell numbers in blood as determined by flow cytometry for CD19 and (G) ELISA for serum IgG concentration over time after transplant. H. Normal mice were immunized with 20 μg of NP-Ovalbumin (n=10) and given normal or DCA containing water. ELISA was used to measure total serum anti-NIP IgG concentrations over time. N.D. not determined detected. Data are representative of 3 or more independent experiments and means and standard deviations are shown. Statistical significance was determined by Student’s T test (* p≤0.05, ** p≤0.005, N.S. not significant).
Figure 8
Figure 8. Glut1 is required for B cell homeostasis and efficient antibody production
A, B. Control (Glut1+/+) and Glut1fl/fl CD19-Cre mice were analyzed by flow cytometry and spleen cell count to (A) determine the total number of B220+ cells in spleen and (B) IgM and IgD expression. (C) Purified B cells from control (Glut1+/+) and Glut1fl/fl CD19-Cre mice were unstimulated (−) or stimulated with LPS or anti-IgM for 24 hours and analyzed by immunoblot. D. Sera from 6 control (Glut1+/+) and 6 Glut1fl/fl CD19-Cre mice were analyzed by ELISA for total or NP-specific IgM on days 7, 15, and 21 after immunization with NP-CGG. NIP5 indicates high affinity and NIP25 indicates high and low affinity antibodies. Representative data of 3 or more independent experiments and means and standard deviations are shown. Statistical significance was determined by Student’s T test (* p≤0.05, ** p≤0.005).

References

    1. Rathmell JC. Metabolism and autophagy in the immune system: immunometabolism comes of age. Immunol Rev. 2012;249:5–13. - PMC - PubMed
    1. Frauwirth KA, Riley JL, Harris MH, Parry RV, Rathmell JC, Plas DR, Elstrom RL, June CH, Thompson CB. The CD28 signaling pathway regulates glucose metabolism. Immunity. 2002;16:769–777. - PubMed
    1. Jacobs SR, Herman CE, Maciver NJ, Wofford JA, Wieman HL, Hammen JJ, Rathmell JC. Glucose Uptake Is Limiting in T Cell Activation and Requires CD28-Mediated Akt-Dependent and Independent Pathways. J Immunol. 2008;180:4476–4486. - PMC - PubMed
    1. Wang R, Green DR. Metabolic reprogramming and metabolic dependency in T cells. Immunol Rev. 2012;249:14–26. - PMC - PubMed
    1. Wang RN, Dillon CP, Shi LZ, Milasta S, Carter R, Finkelstein D, McCormick LL, Fitzgerald P, Chi HB, Munger J, Green DR. The Transcription Factor Myc Controls Metabolic Reprogramming upon T Lymphocyte Activation. Immunity. 2011;35:871–882. - PMC - PubMed

Publication types

MeSH terms

Substances