Comparative Study
. 2014 Apr 15;111(15):5610-5.
doi: 10.1073/pnas.1316145111. Epub 2014 Mar 10.

Thermal-safety margins and the necessity of thermoregulatory behavior across latitude and elevation

Affiliations
Comparative Study

Thermal-safety margins and the necessity of thermoregulatory behavior across latitude and elevation

Jennifer M Sunday et al. Proc Natl Acad Sci U S A. .

Abstract

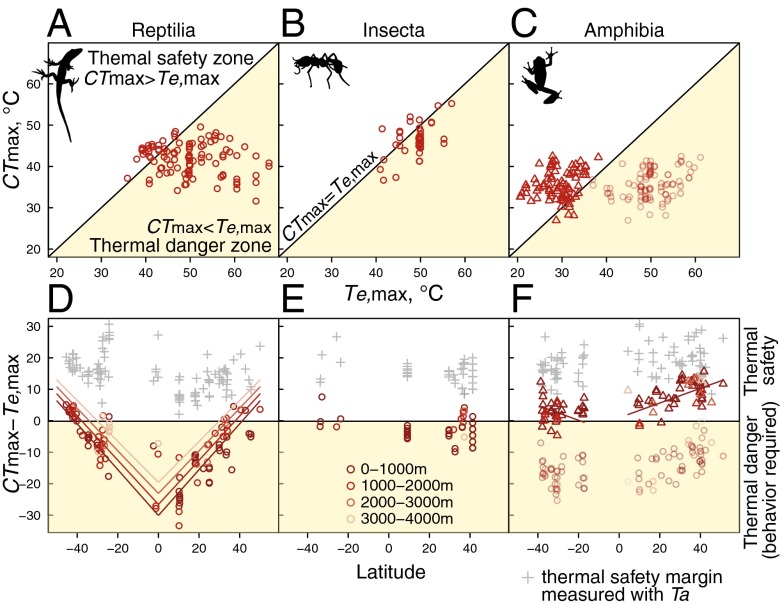
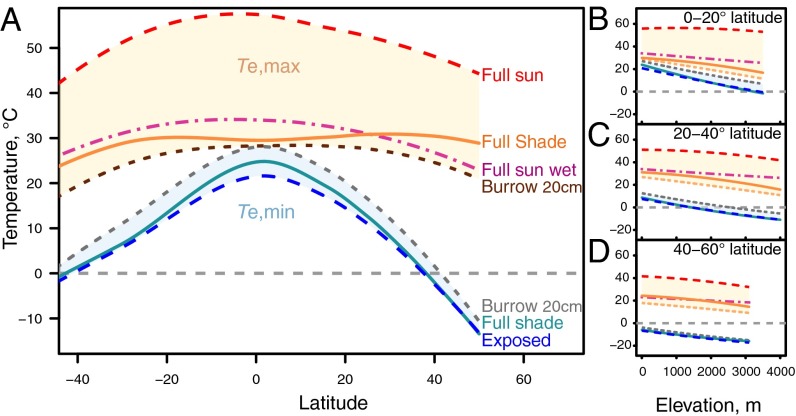
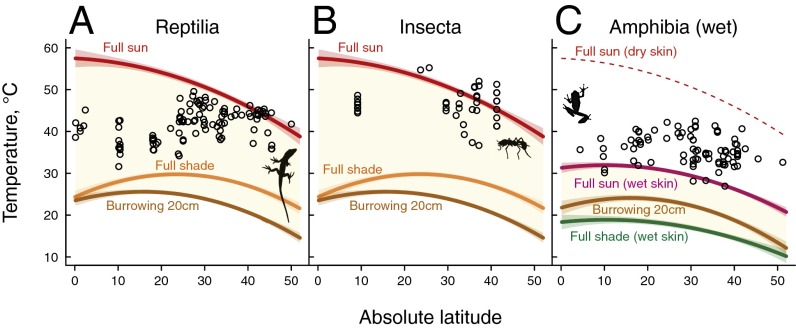
Physiological thermal-tolerance limits of terrestrial ectotherms often exceed local air temperatures, implying a high degree of thermal safety (an excess of warm or cold thermal tolerance). However, air temperatures can be very different from the equilibrium body temperature of an individual ectotherm. Here, we compile thermal-tolerance limits of ectotherms across a wide range of latitudes and elevations and compare these thermal limits both to air and to operative body temperatures (theoretically equilibrated body temperatures) of small ectothermic animals during the warmest and coldest times of the year. We show that extreme operative body temperatures in exposed habitats match or exceed the physiological thermal limits of most ectotherms. Therefore, contrary to previous findings using air temperatures, most ectotherms do not have a physiological thermal-safety margin. They must therefore rely on behavior to avoid overheating during the warmest times, especially in the lowland tropics. Likewise, species living at temperate latitudes and in alpine habitats must retreat to avoid lethal cold exposure. Behavioral plasticity of habitat use and the energetic consequences of thermal retreats are therefore critical aspects of species' vulnerability to climate warming and extreme events.

Keywords: climate sensitivity; macrophysiology; operative temperature.


Conflict of interest statement

The authors declare no conflict of interest.

Figures

Fig. 1.
Fig. 1.
Maximum and minimum thermal-tolerance limits and range of annual extreme air and operative body temperatures as a function of latitude (A) and elevation (BD). Warm and cool color points indicate upper and lower thermal-tolerance limits, respectively, after correcting for different acclimation temperatures. Lines indicate relationships from best-fit linear models of thermal tolerance, which take into account taxonomy and different metrics of cold tolerance. The gray region shows the range of hourly air temperatures across the year, and the light yellow region shows the range of extreme operative temperatures across the year, based on local regressions of lowland temperature data as a function of latitude (A) and on linear models of temperature as a function of latitude and elevation (BD).
Fig. 2.
Fig. 2.
(AC) Phase diagrams of heat-tolerance limits and maximum operative body temperature for reptiles, insects, and amphibians. The white region shows where species have a physiological thermal-safety margin even in open habitats, and the light yellow region shows where species are dependent on behavior or microhabitats to avoid maximum operative temperatures in open habitats. (DF) Warm thermal-safety margins as a function of latitude based on maximum exposed operative temperatures (CTmax - Te,max; circles). Colors indicate elevation, and lines show best-fit regressions from linear models that had a slope significantly different from zero. Gray crosses indicate thermal-safety margins based on maximum air temperature (CTmaxTa,max). Positive values indicate physiological thermal safety whereas negative values represent thermal danger and reliance on cooling habitats and behaviors.
Fig. 3.
Fig. 3.
(AC) Phase diagrams of cold-tolerance limits and maximum operative body temperature for reptiles, insects, and amphibians. The white region shows where species have a physiological thermal-safety margin even in the coldest operative temperatures whereas the gray region shows where species are dependent on behavior or microhabitat use to avoid minimum operative temperatures in open habitats. (DF) Cold thermal-safety margins as a function of latitude based on minimum exposed operative temperatures (Te,min − CTmin; circles). Positive values indicate physiological thermal safety whereas negative values represent thermal danger and reliance on cold-buffering habitats and behaviors. Colors indicate elevation, and lines show best-fit regression from linear models that were significantly different from zero.
Fig. 4.
Fig. 4.
Operative body temperatures under various strategies of microhabitat use. (A) Operative temperature as a function of latitude. Lines show local regressions of lowland temperature data as a function latitude (A) and linear models of temperature as a function of latitude and elevation (BD) (see Fig. S1 for Te estimates by location).
Fig. 5.
Fig. 5.
Microhabitat use strategies available to ectotherms for maintaining operative body temperatures within tolerable heat limits. Curves bounding the light yellow region show operative body temperatures in full sun, shade, and burrowing to 20 cm, as a function of latitude (at a fixed mean elevation of 800 m), based on linear models (Table S1). CTmax (black points) are within the range of maximum operative body temperatures (light yellow region) for most reptiles (A) and insects (B), indicating the necessity for microhabitat use. For amphibians (C), CTmax exceeds the range of maximum operative temperatures if skin is wet (yellow region) but not if skin is dry (dotted red line).

Comment in

References

    1. Williams SE, Shoo LP, Isaac JL, Hoffmann AA, Langham G. Towards an integrated framework for assessing the vulnerability of species to climate change. PLoS Biol. 2008;6(12):2621–2626. - PMC - PubMed
    1. Foden WB, et al. Identifying the world’s most climate change vulnerable species: A systematic trait-based assessment of all birds, amphibians and corals. PLoS ONE. 2013;8(6):e65427. - PMC - PubMed
    1. Deutsch CA, et al. Impacts of climate warming on terrestrial ectotherms across latitude. Proc Natl Acad Sci USA. 2008;105(18):6668–6672. - PMC - PubMed
    1. Huey RB, et al. Why tropical forest lizards are vulnerable to climate warming. Proc R Soc Lond Ser B Biol Sci. 2009;276:1939–1948. - PMC - PubMed
    1. Clusella-Trullas S, Blackburn TM, Chown SL. Climatic predictors of temperature performance curve parameters in ectotherms imply complex responses to climate change. Am Nat. 2011;177(6):738–751. - PubMed

Publication types

LinkOut - more resources