. 2014 Feb 28:8:25.
doi: 10.3389/fnins.2014.00025. eCollection 2014.

Stable individual characteristics in the perception of multiple embedded patterns in multistable auditory stimuli

Affiliations

Stable individual characteristics in the perception of multiple embedded patterns in multistable auditory stimuli

Susan Denham et al. Front Neurosci. .

Abstract

The ability of the auditory system to parse complex scenes into component objects in order to extract information from the environment is very robust, yet the processing principles underlying this ability are still not well understood. This study was designed to investigate the proposal that the auditory system constructs multiple interpretations of the acoustic scene in parallel, based on the finding that when listening to a long repetitive sequence listeners report switching between different perceptual organizations. Using the "ABA-" auditory streaming paradigm we trained listeners until they could reliably recognize all possible embedded patterns of length four which could in principle be extracted from the sequence, and in a series of test sessions investigated their spontaneous reports of those patterns. With the training allowing them to identify and mark a wider variety of possible patterns, participants spontaneously reported many more patterns than the ones traditionally assumed (Integrated vs. Segregated). Despite receiving consistent training and despite the apparent randomness of perceptual switching, we found individual switching patterns were idiosyncratic; i.e., the perceptual switching patterns of each participant were more similar to their own switching patterns in different sessions than to those of other participants. These individual differences were found to be preserved even between test sessions held a year after the initial experiment. Our results support the idea that the auditory system attempts to extract an exhaustive set of embedded patterns which can be used to generate expectations of future events and which by competing for dominance give rise to (changing) perceptual awareness, with the characteristics of pattern discovery and perceptual competition having a strong idiosyncratic component. Perceptual multistability thus provides a means for characterizing both general mechanisms and individual differences in human perception.

Keywords: auditory scene analysis; auditory streaming; individual differences; multistability; perceptual switching.


Figures

Figure 1
Figure 1
Embedded repeating patterns up to length four that can, in theory, be perceived by listeners in the auditory streaming paradigm. Yellow rectangles indicate the foreground pattern. Feature differences, in this case frequency differences, are indicated by displacement in a vertical direction for the tones in each sequence. The foreground and compatible (background) patterns for each dominant (emphasized) pattern are indicated to the right in letter form.
Figure 2
Figure 2
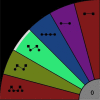
Response interface. Participants were instructed to press the colored area corresponding to their dominant (foreground) percept, as indicated by the icons. Starting from the lowest area these patterns can be expressed using letters as ABA-, AB--, -BA-, A-, A---, B---, confused (gray area “0”). In this screen shot, the -BA- pattern is being reported as the currently perceived pattern (indicated by higher intensity and the white segment at the outer edge of the region).
Figure 3
Figure 3
Verification of pattern recognition. Top: Proportion of the verification sections in which each emphasized pattern was reported. Bottom: Proportion of the verification sections in which each participant reported the emphasized patterns. Blue bars show the mean proportion of matching responses, red bars show the additional proportion accounted for by the latency to the first switch to the matching response.
Figure 4
Figure 4
Total proportion of each pattern, pooling the data from all participants, all sessions and all conditions in Experiment 1. On each box, the central red line is the median, the upper and lower edges of the boxes are the 25th and 75th percentiles, the whiskers extend to the most extreme data points considered not to be outliers; outliers are plotted individually as red crosses. Top: Proportion of each pattern reported by participants (median values: ABA- 51.39%, AB-- 0.13%, -BA- 14.02%, A- 9.49%, A--- 0.02%, B--- 20.78%, confused 0.0008%). Bottom: Patterns grouped according to the perceptual organizations that participants were allowed to report in our previous studies: integrated (ABA-), segregated (A-, B---), and both (AB--, -BA-, A---).
Figure 5
Figure 5
Proportion of the total stimulus duration during which each pattern was perceived (color coded as indicated by the accompanying legend) for each condition, calculated from the condition transition matrices constructed by pooling the data from all participants for each condition (Denham et al., 2012). Top: Proportion of each pattern reported by participants. Bottom: Proportion of each pattern grouped according to the perceptual organizations that participants were allowed to report in our previous studies; integrated (ABA-), segregated (A-, B---), and both (AB--, -BA-, A---).
Figure 6
Figure 6
Phase durations of each pattern, pooling the data from all participants, all sessions and all conditions in experiment 1; see Figure 4 for figure conventions.
Figure 7
Figure 7
Median latency of each pattern (color coded as indicated by the accompanying legend). Top: Median latency for the first report of each pattern in each condition, pooling all participants. Bottom: Median latency for the first report of each pattern by each participant, pooling all conditions.
Figure 8
Figure 8
Distribution of response latencies. Top: Distribution of latencies for all patterns combined, for all data in Experiment 1; for clarity latency is plotted as the log of the latency in milliseconds. Bottom: Cumulative distribution of latency for each pattern separately, combining data from all participants and sessions. Each line represents the proportion of latencies of the pattern indicated by the color code (see legend) less than the latency indicated along the x axis. For example, at a latency of 100 s, less than 20% of first reports of A--- have occurred, while more than 90% of first ABA- reports have occurred.
Figure 9
Figure 9
Individual differences within Experiment 1. Comparison between intra- and inter-individual perceptual switching behavior, characterized by participant transition matrices extracted for each participant for each test session, pooling data from all conditions; differences between transition matrices from the same participant at different sessions (black dots; median—black diamonds, line), differences between the transition matrices of each participant and those of all other participants (red dots; median—red diamonds, line).
Figure 10
Figure 10
Individual differences within and between Experiments 1 and 2. Comparison between intra- and inter-individual perceptual switching behavior, characterized by participant transition matrices extracted for each participant for each test session, pooling data from all conditions. Differences between transition matrices from the same participant in different sessions in Experiment 1 (black dots; median—black diamonds, line), differences between transition matrices of each participant in Experiment 1 vs. sessions from the same participant in Experiment 2 (blue dots; median—blue diamonds, line), differences between the transition matrices of each participant and those of all other participants in Experiment 1 (red dots; median—red diamonds, line), and differences between the transition matrices of each participant from Experiment 1 and those of all other participants in Experiment 2 (magenta dots; median—magenta diamonds, line).
Figure 11
Figure 11
Proportion of the total stimulus duration during which each pattern was perceived (color coded as indicated by the accompanying legend) for each condition, calculated from the condition transition matrices constructed by pooling the data from all participants for each condition (Bõhm et al., 2013).
Figure 12
Figure 12
Comparison between intra- and inter-individual perceptual switching behavior in Experiment 3; differences between transition matrices from the same participant at different sessions (black dots; median—black diamonds, line), and differences between the transition matrices of each participant and those of all other participants (red dots; median—red diamonds, line).

References

    1. Aafjes M., Hueting J. E., Visser P. (1966). Individual and interindividual differences in binocular retinal rivalry in man. Psychophysiology 3, 18–22 10.1111/j.1469-8986.1966.tb02674.x - DOI - PubMed
    1. Anstis S., Saida S. (1985). Adaptation to auditory streaming of frequency-modulated tones. J. Exp. Psychol. Hum. Percept. Perform. 11, 257–271 10.1037/0096-1523.11.3.257 - DOI
    1. Bendixen A., Bõhm T. M., Szalárdy O., Mill R., Denham S. L., Winkler I. (2013). Different roles of similarity and predictability in auditory stream segregation. Learn. Percept. 2, 37–54 10.1556/LP.5.2013.Suppl2.4 - DOI
    1. Bendixen A., Denham S. L., Gyimesi K., Winkler I. (2010). Regular patterns stabilize auditory streams. J. Acoust. Soc. Am. 128, 3658–3666 10.1121/1.3500695 - DOI - PubMed
    1. Boh B., Herholz S. C., Lappe C., Pantev C. (2011). Processing of complex auditory patterns in musicians and nonmusicians. PLoS ONE 6:e21458 10.1371/journal.pone.0021458 - DOI - PMC - PubMed

LinkOut - more resources