Review
. 2014 Feb 26:8:19.
doi: 10.3389/fninf.2014.00019. eCollection 2014.

Neuroinformatics challenges to the structural, connectomic, functional and electrophysiological multimodal imaging of human traumatic brain injury

Affiliations
Review

Neuroinformatics challenges to the structural, connectomic, functional and electrophysiological multimodal imaging of human traumatic brain injury

S Y Matthew Goh et al. Front Neuroinform. .

Abstract

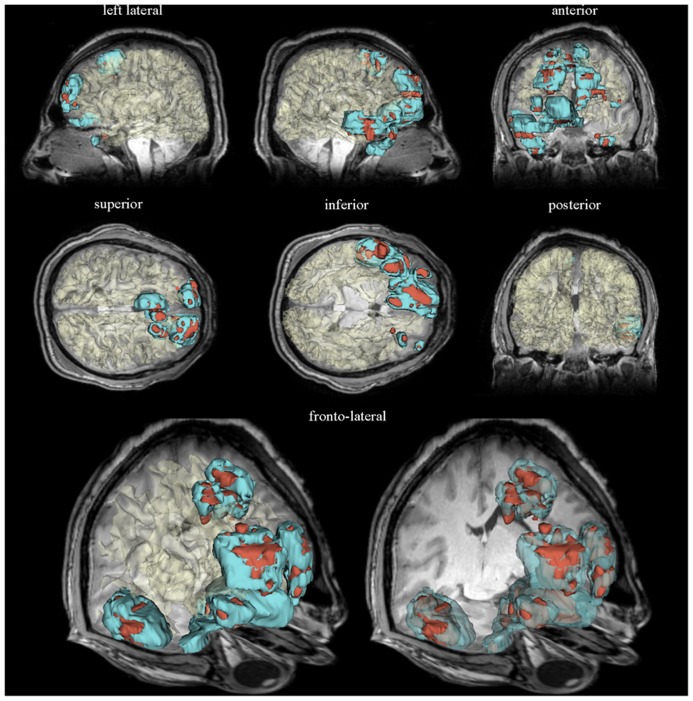
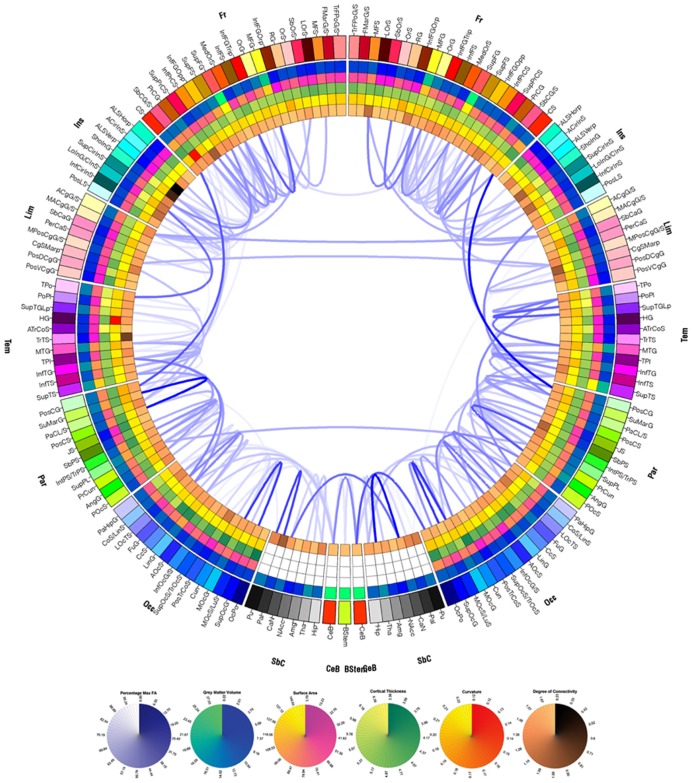
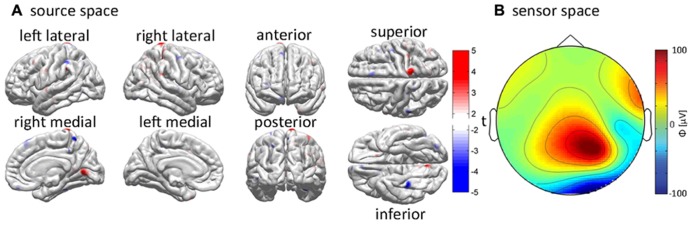
Throughout the past few decades, the ability to treat and rehabilitate traumatic brain injury (TBI) patients has become critically reliant upon the use of neuroimaging to acquire adequate knowledge of injury-related effects upon brain function and recovery. As a result, the need for TBI neuroimaging analysis methods has increased in recent years due to the recognition that spatiotemporal computational analyses of TBI evolution are useful for capturing the effects of TBI dynamics. At the same time, however, the advent of such methods has brought about the need to analyze, manage, and integrate TBI neuroimaging data using informatically inspired approaches which can take full advantage of their large dimensionality and informational complexity. Given this perspective, we here discuss the neuroinformatics challenges for TBI neuroimaging analysis in the context of structural, connectivity, and functional paradigms. Within each of these, the availability of a wide range of neuroimaging modalities can be leveraged to fully understand the heterogeneity of TBI pathology; consequently, large-scale computer hardware resources and next-generation processing software are often required for efficient data storage, management, and analysis of TBI neuroimaging data. However, each of these paradigms poses challenges in the context of informatics such that the ability to address them is critical for augmenting current capabilities to perform neuroimaging analysis of TBI and to improve therapeutic efficacy.

Keywords: DTI; MRI; connectomics; neuroanatomy; neuroinformatics; rehabilitation; traumatic brain injury.


Figures

FIGURE 1
FIGURE 1
Three-dimensional models of semi-automatically segmented healthy-appearing and pathology-affected tissues are displayed for a sample patient with severe TBI within a neuroinformatics framework. Representative slices of the T1 volume acquired 3 days after injury are superimposed. Models of edematous and hemorrhagic tissues are colored in cyan and dark red, respectively. The WM surface was segmented automatically using FreeSurfer, demonstrating the capabilities of this software package to perform automatic tissue classification of healthy-appearing tissues. The WM model is translucent in each brain view to facilitate the visibility of anatomic details obviated in the MR volume slice displayed. See Irimia et al. (2011) for a detailed description of the neuroinformatics methodology used to generate these visualizations.
FIGURE 2
FIGURE 2
Circular connectogram representation graphically displays WM atrophy over a 6 month period. The left and right halves of the connectogram correspond to the left and right hemispheres, respectively. Each hemisphere of the brain is divided into frontal, insular, limbic, temporal, parietal and occipital lobes, as well as into subcortical structures, cerebellum, and the brain stem; the latter three are represented at the bottom of the circle. Each lobe is further divided into parcels (gyri and sulci in the case of the cortex) and is assigned a unique identifying color. Radially aligned, concentric rings represented using various color schemes depict various attributes of each corresponding brain parcel. From the outermost to the innermost one, the rings contain wedges which encode GM volume, surface area, cortical thickness, curvature, and degree of connectivity. A link of variable opacity is drawn between certain pairs of brain parcels, reflecting structural connectivity properties between regions. In the case of the connectogram displayed, links displayed indicate connections which suffered from large atrophy from the acute baseline to the chronic follow-up time point. Link transparency encodes the percentage change Δ in fiber density, in the range [min(Δ), max(Δ)], with larger changes (more negative values of Δ) being encoded by more opaque hues of blue. The lowest color opacity corresponds to the smallest absolute value of the percentage change which is greater than the selected threshold of 30%, and the highest opacity corresponds to the maximum absolute value of the change in fiber density. See Irimia et al. (2012a) for details.
FIGURE 3
FIGURE 3
Example of EEG inverse localization in a sample acute TBI patient using an integrative pipeline. The cortical sources responsible for the generation of recorded EEG waveforms are determined using the application of a minimum norm inverse localization method. (A) EEG potentials recorded over the scalp (i.e., in “sensor space”) are inversely localized onto the cortical surface (i.e., into “source space”). The inverse estimate of the cortical activity responsible for the generation of EEG signals is plotted using t scores, which indicate the likelihood for each cortical location to be electrically active. The magnitude of t indicates whether the localized electric current is oriented out of (t > 0, red hues) or into (t < 0, blue hues) the cortex. (B) The interpolated values of the potentials measured at each sensor location are mapped over an idealized, circular representation of the scalp to generate a topographic map. Color indicates the magnitude of the recorded electric potential ϕ in μV. See Irimia et al. (2013b) for further details.

References

    1. Achard S., Delon-Martin C., Vertes P. E., Renard F., Schenck M., Schneider F., et al. (2012). Hubs of brain functional networks are radically reorganized in comatose patients. Proc. Natl. Acad. Sci. U.S.A. 109 20608–2061310.1073/pnas.1208933109 - DOI - PMC - PubMed
    1. Akil H., Martone M. E, Van Essen D. C. (2011). Challenges and opportunities in mining neuroscience data. Science 331 708–71210.1126/science.1199305 - DOI - PMC - PubMed
    1. Arfanakis K., Haughton V. M., Carew J. D., Rogers B. P., Dempsey R. J., Meyerand M. E. (2002). Diffusion tensor MR imaging in diffuse axonal injury. Am. J. Neuroradiol. 23 794–802 - PMC - PubMed
    1. Ashburner J., Friston K. J. (2000). Voxel-based morphometry–the methods. Neuroimage 11 805–82110.1006/nimg.2000.0582 - DOI - PubMed
    1. Bug W. J., Ascoli G. A., Grethe J. S., Gupta A., Fennema-Notestine C., Laird A. R., et al. (2008). The NIFSTD and BIRNLex vocabularies: building comprehensive ontologies for neuroscience. Neuroinformatics 6 175–19410.1007/s12021-008-9032-z - DOI - PMC - PubMed