

Population pharmacokinetics and pharmacodynamics of BYL719, a phosphoinositide 3-kinase antagonist, in adult patients with advanced solid malignancies
- PMID: 24617631
- PMCID: PMC4243905
- DOI: 10.1111/bcp.12378
Population pharmacokinetics and pharmacodynamics of BYL719, a phosphoinositide 3-kinase antagonist, in adult patients with advanced solid malignancies
Abstract
Aims: The aim was to characterize the population pharmacokinetics of BYL719 in cancer patients and assess the time course of tumour response in relation to drug exposure and dosing schedule.
Methods: Plasma samples and longitudinal tumour size measurements were collected from 60 patients with advanced solid malignancies who received oral BYL719 once daily (30-450 mg) or twice daily at 120 mg or 200 mg. Non-linear mixed effect modelling was employed to develop the population pharmacokinetic and pharmacodynamic model.
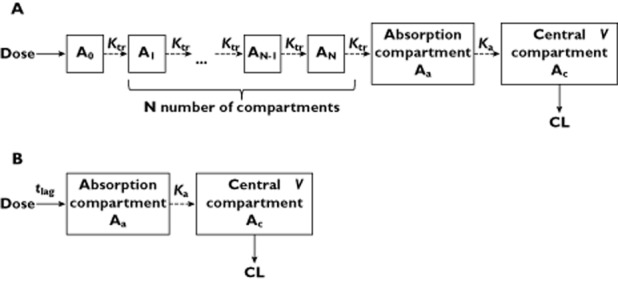
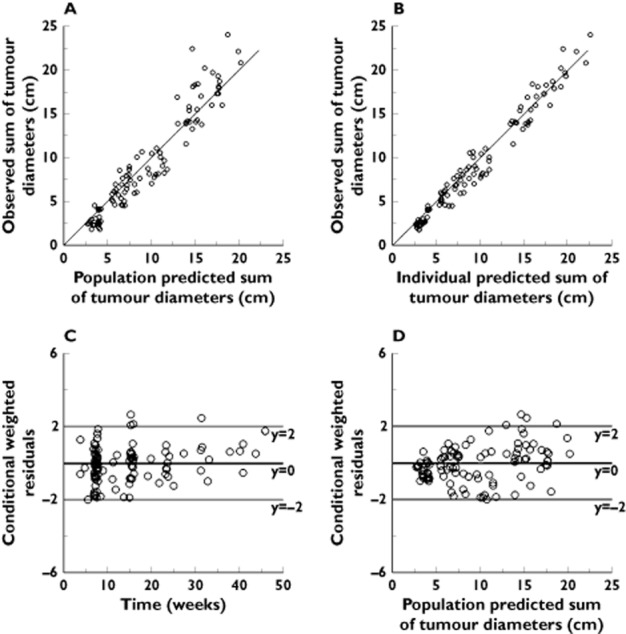
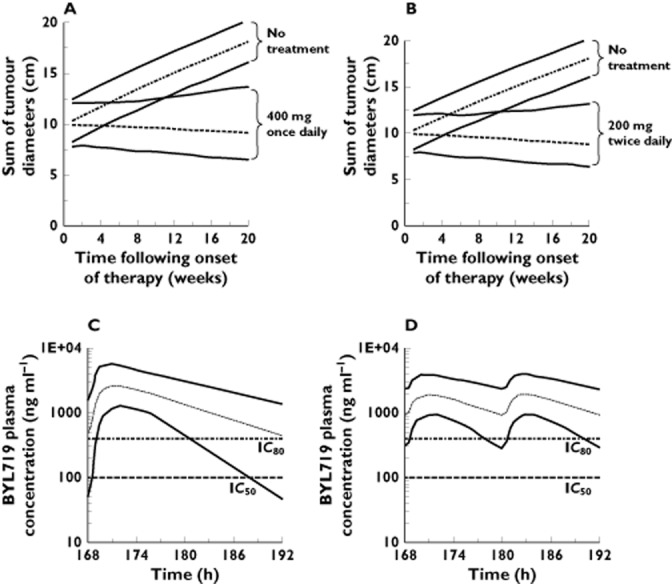
Results: The pharmacokinetics were best described by a one compartment disposition model and transit compartments accounting for the lag time in absorption. The typical population oral clearance and volume of distribution estimates with their between-subject variability (BSV) were 10 l h(-1) (BSV 26%) and 108 l (BSV 28%), respectively. The estimated optimal number of transit compartments was 8.1, with a mean transit time to the absorption compartment of 1.28 h (BSV 32%). The between-occasion variability in the rate and extent of absorption was 46% and 26%, respectively. Tumour growth was modelled using a turnover model characterized by a zero order growth rate of 0.581 cm week(1) and a first order death rate of 0.0123 week(-1) . BYL719 inhibited tumour growth with an IC50 of 100 ng ml(-1) (BSV 154%). Model-based predictions showed potential for additional anti-tumour activity of twice daily dosing at total daily dose below 400 mg, but a loss of efficacy if administered less frequently than once daily.
Conclusions: The proposed model provides a valuable approach for planning future clinical studies and for designing optimized dosing regimens with BYL719.
Keywords: BYL719; RECIST; cancer; phosphoinositide 3-kinase; population pharmacokinetics; transit compartment.
© 2014 The British Pharmacological Society.
Figures
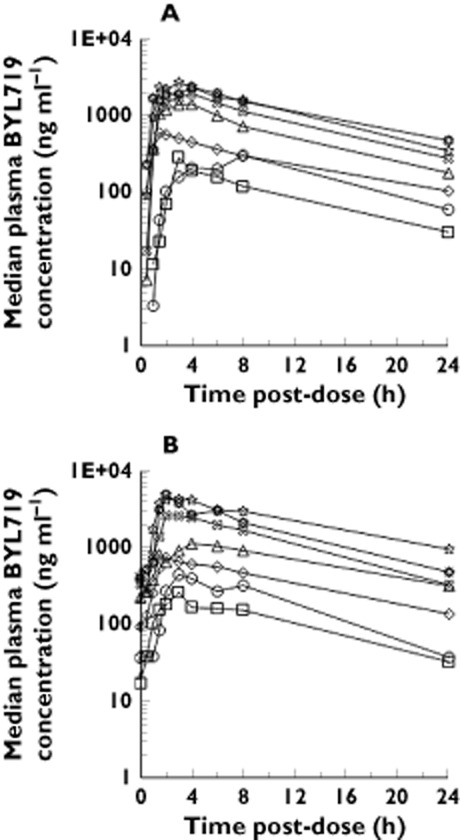
 ) 30 mg once daily, (
 ) 60 mg once daily, (
 ) 90 mg once daily, (
 ) 180 mg once daily, (
 ) 270 mg once daily, (
 ) 400 mg once daily, (
 ) 450 mg once daily
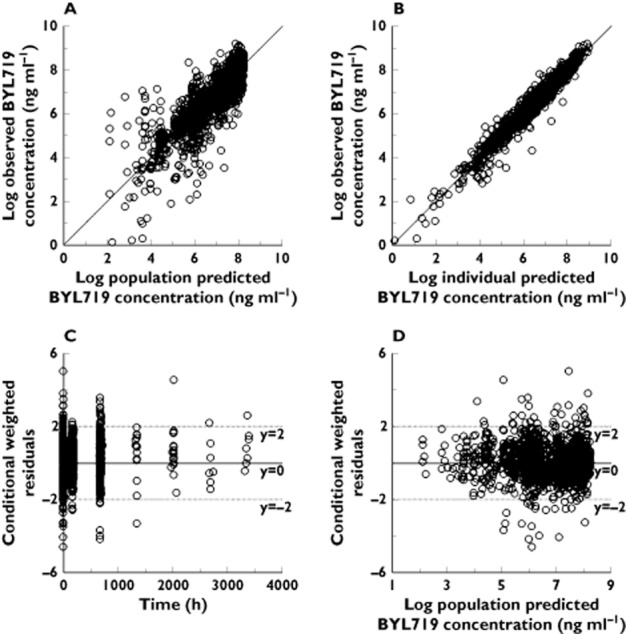
References
-
- Engelman JA, Luo J, Cantley LC. The evolution of phosphatidylinositol 3-kinases as regulators of growth and metabolism. Nat Rev Genet. 2006;7:606–619. - PubMed
-
- Vivanco I, Sawyers CL. The phosphatidylinositol 3-kinase AKT pathway in human cancer. Nat Rev Cancer. 2002;2:489–501. - PubMed
-
- Fruman DA, Meyers RE, Cantley LC. Phosphoinositide kinases. Annu Rev Biochem. 1998;67:481–507. - PubMed
-
- Katso R, Okkenhaug K, Ahmadi K, White S, Timms J, Waterfield MD. Cellular function of phosphoinositide 3-kinases: implications for development, homeostasis, and cancer. Annu Rev Cell Dev Biol. 2001;17:615–675. - PubMed
Publication types
MeSH terms
Substances
LinkOut - more resources
Full Text Sources
Other Literature Sources
