. 2014 Mar-Apr;34(2):377-95.
doi: 10.1148/rg.342125121.

Myocardial T1 mapping: techniques and potential applications

Affiliations

Myocardial T1 mapping: techniques and potential applications

Jeremy R Burt et al. Radiographics. 2014 Mar-Apr.

Abstract

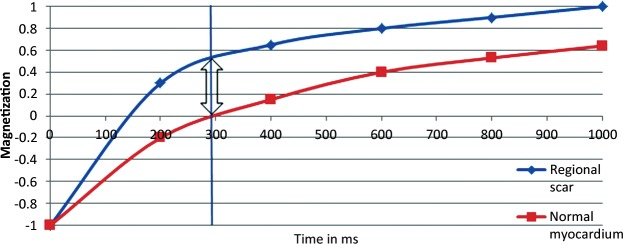
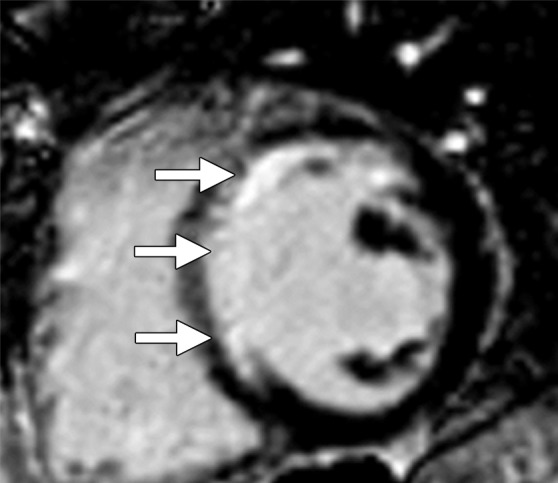
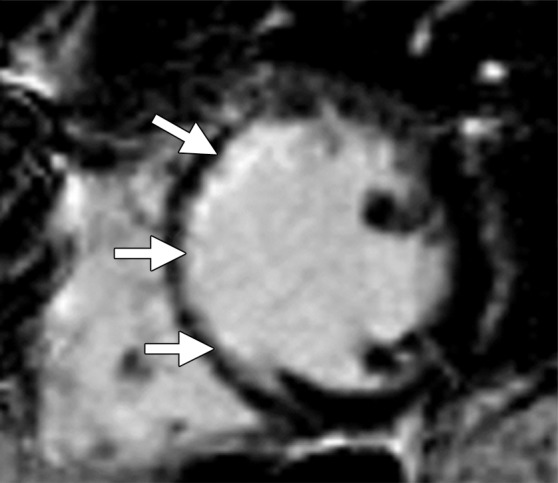
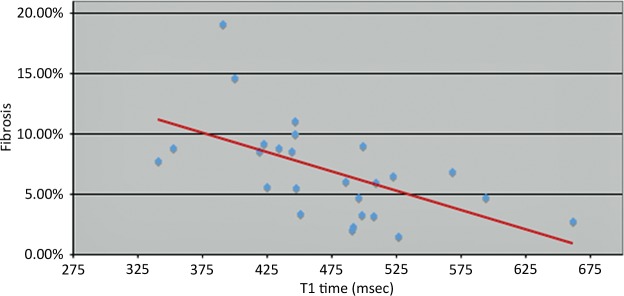
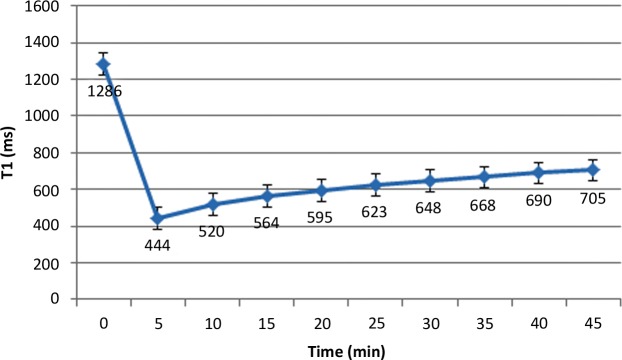
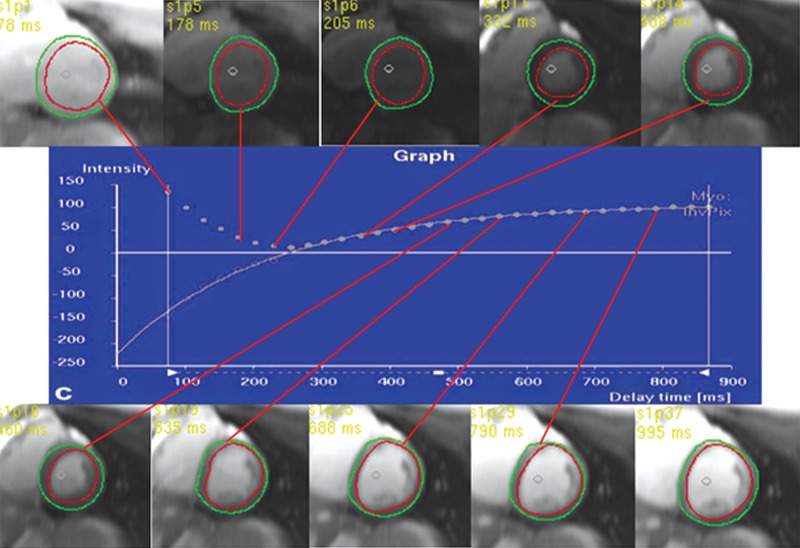
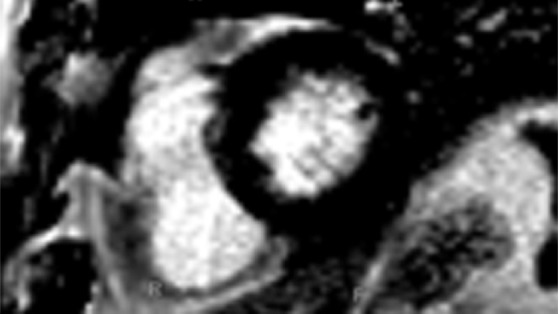
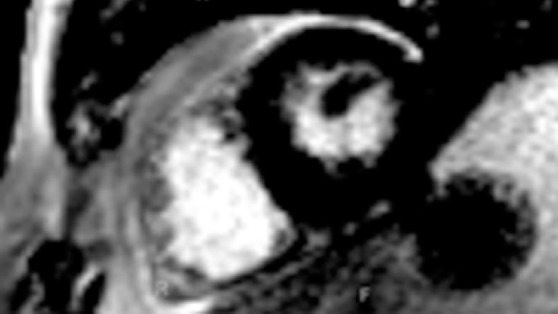
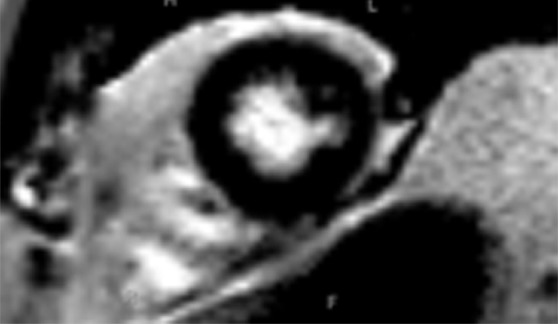
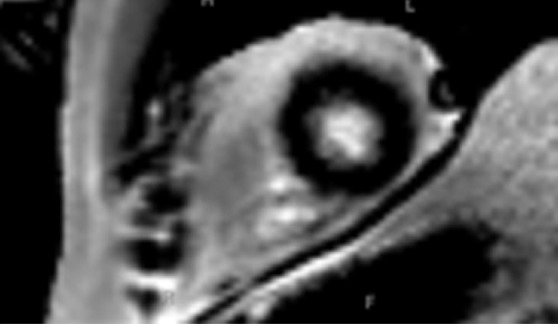
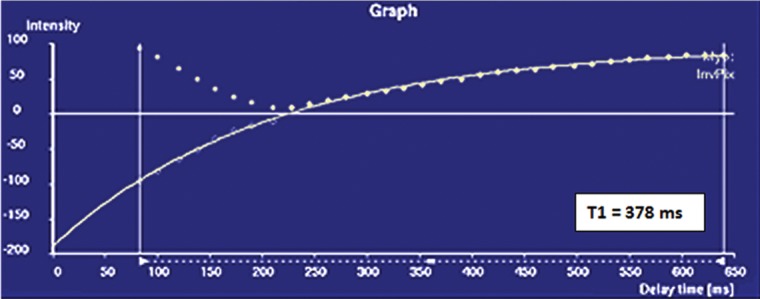
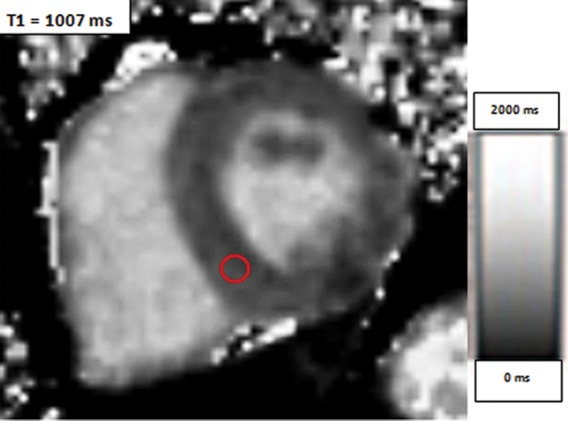
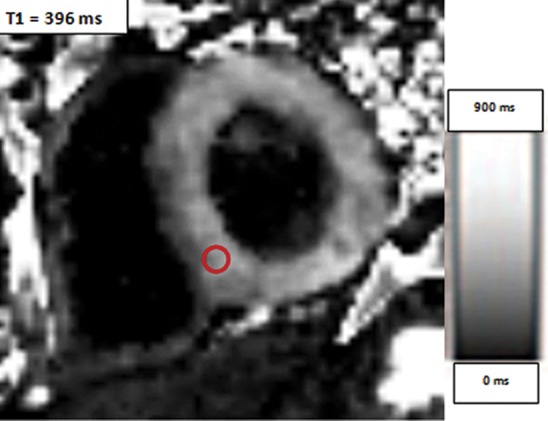
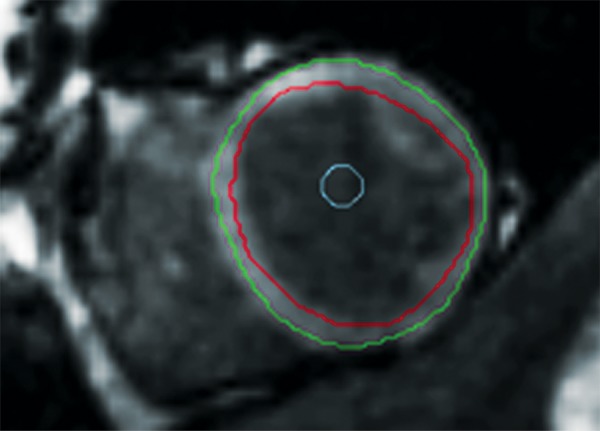
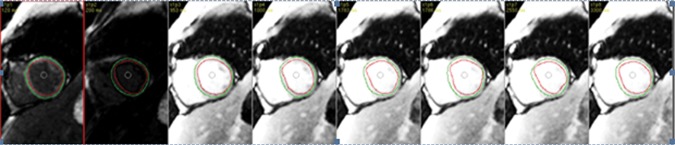
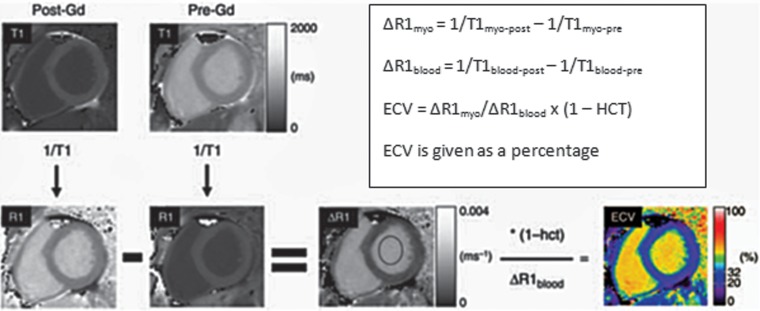
Myocardial fibrosis is a common endpoint in a variety of cardiac diseases and a major independent predictor of adverse cardiac outcomes. Short of histopathologic analysis, which is limited by sampling bias, most diagnostic modalities are limited in their depiction of myocardial fibrosis. Cardiac magnetic resonance (MR) imaging has the advantage of providing detailed soft-tissue characterization, and a variety of novel quantification methods have further improved its usefulness. Contrast material-enhanced cardiac MR imaging depends on differences in signal intensity between regions of scarring and adjacent normal myocardium. Diffuse myocardial fibrosis lacks these differences in signal intensity. Measurement of myocardial T1 times (T1 mapping) with gadolinium-enhanced inversion recovery-prepared sequences may depict diffuse myocardial fibrosis and has good correlation with ex vivo fibrosis content. T1 mapping calculates myocardial T1 relaxation times with image-based signal intensities and may be performed with standard cardiac MR imagers and radiologic workstations. Myocardium with diffuse fibrosis has greater retention of contrast material, resulting in T1 times that are shorter than those in normal myocardium. Early studies have suggested that diffuse myocardial fibrosis may be distinguished from normal myocardium with T1 mapping. Large multicenter studies are needed to define the role of T1 mapping in developing prognoses and therapeutic assessments. However, given its strengths as a noninvasive method for direct quantification of myocardial fibrosis, T1 mapping may eventually play an important role in the management of cardiac disease.


Figures

Figure 1a
Figure 1a
Use of Masson trichrome staining in three patients. Red areas = cardiomyocytes, blue areas = fibrillar collagen network. (a) Photomicrograph (Masson trichrome stain; original magnification, ×10) shows normal myocardium. (b) Photomicrograph (Masson trichrome stain; original magnification, ×10) obtained in a patient with nonischemic dilated cardiomyopathy shows reactive interstitial fibrosis. (c) Photomicrograph (Masson trichrome stain; original magnification, ×10) obtained in a patient with chronic myocardial infarction shows replacement fibrosis (scarring).
Figure 1b
Figure 1b
Use of Masson trichrome staining in three patients. Red areas = cardiomyocytes, blue areas = fibrillar collagen network. (a) Photomicrograph (Masson trichrome stain; original magnification, ×10) shows normal myocardium. (b) Photomicrograph (Masson trichrome stain; original magnification, ×10) obtained in a patient with nonischemic dilated cardiomyopathy shows reactive interstitial fibrosis. (c) Photomicrograph (Masson trichrome stain; original magnification, ×10) obtained in a patient with chronic myocardial infarction shows replacement fibrosis (scarring).
Figure 1c
Figure 1c
Use of Masson trichrome staining in three patients. Red areas = cardiomyocytes, blue areas = fibrillar collagen network. (a) Photomicrograph (Masson trichrome stain; original magnification, ×10) shows normal myocardium. (b) Photomicrograph (Masson trichrome stain; original magnification, ×10) obtained in a patient with nonischemic dilated cardiomyopathy shows reactive interstitial fibrosis. (c) Photomicrograph (Masson trichrome stain; original magnification, ×10) obtained in a patient with chronic myocardial infarction shows replacement fibrosis (scarring).
Figure 2
Figure 2
Graph shows the relaxation times of myocardium and focal scarring. In this example, maximal contrast (arrow) between regional scarring (blue line) and normal myocardium (red line) is achieved with an inversion time of 290 msec (vertical line).
Figure 3a
Figure 3a
Replacement fibrosis in a patient with a history of left anterior descending artery occlusion. Short-axis delayed contrast-enhanced phase-sensitive inversion-recovery (PSIR) MR images obtained at 1.5 T show regional subendocardial scarring (replacement fibrosis) in the septum and anteroseptal wall (arrows).
Figure 3b
Figure 3b
Replacement fibrosis in a patient with a history of left anterior descending artery occlusion. Short-axis delayed contrast-enhanced phase-sensitive inversion-recovery (PSIR) MR images obtained at 1.5 T show regional subendocardial scarring (replacement fibrosis) in the septum and anteroseptal wall (arrows).
Figure 4a
Figure 4a
Reactive interstitial fibrosis in a patient with arrhythmogenic right ventricular cardiomyopathy and dysplasia. (a) Short-axis delayed contrast-enhanced PSIR MR image obtained at 1.5 T shows an absence of late contrast enhancement. (b) Photomicrograph (Masson trichrome stain; original magnification, ×10) of endomyocardial biopsy specimen, obtained around the time that cardiac MR imaging was performed, shows moderate reactive interstitial fibrosis.
Figure 4b
Figure 4b
Reactive interstitial fibrosis in a patient with arrhythmogenic right ventricular cardiomyopathy and dysplasia. (a) Short-axis delayed contrast-enhanced PSIR MR image obtained at 1.5 T shows an absence of late contrast enhancement. (b) Photomicrograph (Masson trichrome stain; original magnification, ×10) of endomyocardial biopsy specimen, obtained around the time that cardiac MR imaging was performed, shows moderate reactive interstitial fibrosis.
Figure 5
Figure 5
Graph plotting data from a study in which 26 patients underwent endomyocardial biopsy and cardiac MR imaging with an LL technique between January 2005 and January 2010 shows an inverse correlation between T1 time and percentage of patients with myocardial fibrosis (r =-0.57, P < 0.0001), which indicates that postcontrast T1 times reflect histologic findings. No late contrast enhancement (ie, regional scarring) was seen. Biopsy specimens underwent digitization and Masson trichrome staining by the pathology department at Johns Hopkins Hospital. With this method, the percentage of histologic fibrosis was correlated with corrected myocardial T1 times. (Reprinted and modified, with permission, from reference 46.)
Figure 6
Figure 6
Graph shows myocardial T1 values that were obtained in a healthy volunteer at various times after intravenous administration of 0.15 mmol/kg gadopentetate dimeglumine. T1 values are expressed as the mean plus or minus the standard deviation.
Figure 7
Figure 7
Graph shows curve fitting of selected short-axis sections from an LL sequence. Inversion times are shown in the upper left corner of each image.
Figure 8a
Figure 8a
T1 mapping performed with LL and MOLLI sequences in a 42-year-old man with mild asymmetric septal hypertrophy and mild to moderate systolic anterior motion of the mitral valve with provocation at echocardiography and a family history of hypertrophic cardiomyopathy. (a–d) Bright blood MR images obtained in the horizontal long-axis plane (a), vertical long-axis plane (b), five-chamber view (c), and short-axis plane (d) show that mid septal thickness reaches 1.3 cm in end diastole. (e–h) Short-axis myocardial delayed enhancement MR images show an absence of late contrast enhancement. (i, j) Postcontrast T1 mapping performed with an LL sequence in the horizontal long-axis plane shows the left ventricular endo- (red line) and epicardial (green line) contours, which are manually drawn. Thirty-two images were acquired throughout the cardiac cycle. (k) Graph shows the data obtained from LL T1 mapping, which were plotted with three-parameter curve fitting and used to calculate T1 times. x-axis = delay time, y-axis = signal intensity. (l, m) Postcontrast T1 mapping performed with a MOLLI sequence in the short-axis plane shows the left ventricular endo- (red line) and epicardial (green line) contours, which are manually drawn. All 11 images were acquired at the same time in end diastole. (n) Graph shows the data obtained from MOLLI T1 mapping, which were plotted with three-parameter curve fitting and used to calculate T1 times. MOLLI and LL sequences had similar T1 values for T1 times after administration of gadolinium contrast material. x-axis = delay time, y-axis = signal intensity.
Figure 8b
Figure 8b
T1 mapping performed with LL and MOLLI sequences in a 42-year-old man with mild asymmetric septal hypertrophy and mild to moderate systolic anterior motion of the mitral valve with provocation at echocardiography and a family history of hypertrophic cardiomyopathy. (a–d) Bright blood MR images obtained in the horizontal long-axis plane (a), vertical long-axis plane (b), five-chamber view (c), and short-axis plane (d) show that mid septal thickness reaches 1.3 cm in end diastole. (e–h) Short-axis myocardial delayed enhancement MR images show an absence of late contrast enhancement. (i, j) Postcontrast T1 mapping performed with an LL sequence in the horizontal long-axis plane shows the left ventricular endo- (red line) and epicardial (green line) contours, which are manually drawn. Thirty-two images were acquired throughout the cardiac cycle. (k) Graph shows the data obtained from LL T1 mapping, which were plotted with three-parameter curve fitting and used to calculate T1 times. x-axis = delay time, y-axis = signal intensity. (l, m) Postcontrast T1 mapping performed with a MOLLI sequence in the short-axis plane shows the left ventricular endo- (red line) and epicardial (green line) contours, which are manually drawn. All 11 images were acquired at the same time in end diastole. (n) Graph shows the data obtained from MOLLI T1 mapping, which were plotted with three-parameter curve fitting and used to calculate T1 times. MOLLI and LL sequences had similar T1 values for T1 times after administration of gadolinium contrast material. x-axis = delay time, y-axis = signal intensity.
Figure 8c
Figure 8c
T1 mapping performed with LL and MOLLI sequences in a 42-year-old man with mild asymmetric septal hypertrophy and mild to moderate systolic anterior motion of the mitral valve with provocation at echocardiography and a family history of hypertrophic cardiomyopathy. (a–d) Bright blood MR images obtained in the horizontal long-axis plane (a), vertical long-axis plane (b), five-chamber view (c), and short-axis plane (d) show that mid septal thickness reaches 1.3 cm in end diastole. (e–h) Short-axis myocardial delayed enhancement MR images show an absence of late contrast enhancement. (i, j) Postcontrast T1 mapping performed with an LL sequence in the horizontal long-axis plane shows the left ventricular endo- (red line) and epicardial (green line) contours, which are manually drawn. Thirty-two images were acquired throughout the cardiac cycle. (k) Graph shows the data obtained from LL T1 mapping, which were plotted with three-parameter curve fitting and used to calculate T1 times. x-axis = delay time, y-axis = signal intensity. (l, m) Postcontrast T1 mapping performed with a MOLLI sequence in the short-axis plane shows the left ventricular endo- (red line) and epicardial (green line) contours, which are manually drawn. All 11 images were acquired at the same time in end diastole. (n) Graph shows the data obtained from MOLLI T1 mapping, which were plotted with three-parameter curve fitting and used to calculate T1 times. MOLLI and LL sequences had similar T1 values for T1 times after administration of gadolinium contrast material. x-axis = delay time, y-axis = signal intensity.
Figure 8d
Figure 8d
T1 mapping performed with LL and MOLLI sequences in a 42-year-old man with mild asymmetric septal hypertrophy and mild to moderate systolic anterior motion of the mitral valve with provocation at echocardiography and a family history of hypertrophic cardiomyopathy. (a–d) Bright blood MR images obtained in the horizontal long-axis plane (a), vertical long-axis plane (b), five-chamber view (c), and short-axis plane (d) show that mid septal thickness reaches 1.3 cm in end diastole. (e–h) Short-axis myocardial delayed enhancement MR images show an absence of late contrast enhancement. (i, j) Postcontrast T1 mapping performed with an LL sequence in the horizontal long-axis plane shows the left ventricular endo- (red line) and epicardial (green line) contours, which are manually drawn. Thirty-two images were acquired throughout the cardiac cycle. (k) Graph shows the data obtained from LL T1 mapping, which were plotted with three-parameter curve fitting and used to calculate T1 times. x-axis = delay time, y-axis = signal intensity. (l, m) Postcontrast T1 mapping performed with a MOLLI sequence in the short-axis plane shows the left ventricular endo- (red line) and epicardial (green line) contours, which are manually drawn. All 11 images were acquired at the same time in end diastole. (n) Graph shows the data obtained from MOLLI T1 mapping, which were plotted with three-parameter curve fitting and used to calculate T1 times. MOLLI and LL sequences had similar T1 values for T1 times after administration of gadolinium contrast material. x-axis = delay time, y-axis = signal intensity.
Figure 8e
Figure 8e
T1 mapping performed with LL and MOLLI sequences in a 42-year-old man with mild asymmetric septal hypertrophy and mild to moderate systolic anterior motion of the mitral valve with provocation at echocardiography and a family history of hypertrophic cardiomyopathy. (a–d) Bright blood MR images obtained in the horizontal long-axis plane (a), vertical long-axis plane (b), five-chamber view (c), and short-axis plane (d) show that mid septal thickness reaches 1.3 cm in end diastole. (e–h) Short-axis myocardial delayed enhancement MR images show an absence of late contrast enhancement. (i, j) Postcontrast T1 mapping performed with an LL sequence in the horizontal long-axis plane shows the left ventricular endo- (red line) and epicardial (green line) contours, which are manually drawn. Thirty-two images were acquired throughout the cardiac cycle. (k) Graph shows the data obtained from LL T1 mapping, which were plotted with three-parameter curve fitting and used to calculate T1 times. x-axis = delay time, y-axis = signal intensity. (l, m) Postcontrast T1 mapping performed with a MOLLI sequence in the short-axis plane shows the left ventricular endo- (red line) and epicardial (green line) contours, which are manually drawn. All 11 images were acquired at the same time in end diastole. (n) Graph shows the data obtained from MOLLI T1 mapping, which were plotted with three-parameter curve fitting and used to calculate T1 times. MOLLI and LL sequences had similar T1 values for T1 times after administration of gadolinium contrast material. x-axis = delay time, y-axis = signal intensity.
Figure 8f
Figure 8f
T1 mapping performed with LL and MOLLI sequences in a 42-year-old man with mild asymmetric septal hypertrophy and mild to moderate systolic anterior motion of the mitral valve with provocation at echocardiography and a family history of hypertrophic cardiomyopathy. (a–d) Bright blood MR images obtained in the horizontal long-axis plane (a), vertical long-axis plane (b), five-chamber view (c), and short-axis plane (d) show that mid septal thickness reaches 1.3 cm in end diastole. (e–h) Short-axis myocardial delayed enhancement MR images show an absence of late contrast enhancement. (i, j) Postcontrast T1 mapping performed with an LL sequence in the horizontal long-axis plane shows the left ventricular endo- (red line) and epicardial (green line) contours, which are manually drawn. Thirty-two images were acquired throughout the cardiac cycle. (k) Graph shows the data obtained from LL T1 mapping, which were plotted with three-parameter curve fitting and used to calculate T1 times. x-axis = delay time, y-axis = signal intensity. (l, m) Postcontrast T1 mapping performed with a MOLLI sequence in the short-axis plane shows the left ventricular endo- (red line) and epicardial (green line) contours, which are manually drawn. All 11 images were acquired at the same time in end diastole. (n) Graph shows the data obtained from MOLLI T1 mapping, which were plotted with three-parameter curve fitting and used to calculate T1 times. MOLLI and LL sequences had similar T1 values for T1 times after administration of gadolinium contrast material. x-axis = delay time, y-axis = signal intensity.
Figure 8g
Figure 8g
T1 mapping performed with LL and MOLLI sequences in a 42-year-old man with mild asymmetric septal hypertrophy and mild to moderate systolic anterior motion of the mitral valve with provocation at echocardiography and a family history of hypertrophic cardiomyopathy. (a–d) Bright blood MR images obtained in the horizontal long-axis plane (a), vertical long-axis plane (b), five-chamber view (c), and short-axis plane (d) show that mid septal thickness reaches 1.3 cm in end diastole. (e–h) Short-axis myocardial delayed enhancement MR images show an absence of late contrast enhancement. (i, j) Postcontrast T1 mapping performed with an LL sequence in the horizontal long-axis plane shows the left ventricular endo- (red line) and epicardial (green line) contours, which are manually drawn. Thirty-two images were acquired throughout the cardiac cycle. (k) Graph shows the data obtained from LL T1 mapping, which were plotted with three-parameter curve fitting and used to calculate T1 times. x-axis = delay time, y-axis = signal intensity. (l, m) Postcontrast T1 mapping performed with a MOLLI sequence in the short-axis plane shows the left ventricular endo- (red line) and epicardial (green line) contours, which are manually drawn. All 11 images were acquired at the same time in end diastole. (n) Graph shows the data obtained from MOLLI T1 mapping, which were plotted with three-parameter curve fitting and used to calculate T1 times. MOLLI and LL sequences had similar T1 values for T1 times after administration of gadolinium contrast material. x-axis = delay time, y-axis = signal intensity.
Figure 8h
Figure 8h
T1 mapping performed with LL and MOLLI sequences in a 42-year-old man with mild asymmetric septal hypertrophy and mild to moderate systolic anterior motion of the mitral valve with provocation at echocardiography and a family history of hypertrophic cardiomyopathy. (a–d) Bright blood MR images obtained in the horizontal long-axis plane (a), vertical long-axis plane (b), five-chamber view (c), and short-axis plane (d) show that mid septal thickness reaches 1.3 cm in end diastole. (e–h) Short-axis myocardial delayed enhancement MR images show an absence of late contrast enhancement. (i, j) Postcontrast T1 mapping performed with an LL sequence in the horizontal long-axis plane shows the left ventricular endo- (red line) and epicardial (green line) contours, which are manually drawn. Thirty-two images were acquired throughout the cardiac cycle. (k) Graph shows the data obtained from LL T1 mapping, which were plotted with three-parameter curve fitting and used to calculate T1 times. x-axis = delay time, y-axis = signal intensity. (l, m) Postcontrast T1 mapping performed with a MOLLI sequence in the short-axis plane shows the left ventricular endo- (red line) and epicardial (green line) contours, which are manually drawn. All 11 images were acquired at the same time in end diastole. (n) Graph shows the data obtained from MOLLI T1 mapping, which were plotted with three-parameter curve fitting and used to calculate T1 times. MOLLI and LL sequences had similar T1 values for T1 times after administration of gadolinium contrast material. x-axis = delay time, y-axis = signal intensity.
Figure 8i
Figure 8i
T1 mapping performed with LL and MOLLI sequences in a 42-year-old man with mild asymmetric septal hypertrophy and mild to moderate systolic anterior motion of the mitral valve with provocation at echocardiography and a family history of hypertrophic cardiomyopathy. (a–d) Bright blood MR images obtained in the horizontal long-axis plane (a), vertical long-axis plane (b), five-chamber view (c), and short-axis plane (d) show that mid septal thickness reaches 1.3 cm in end diastole. (e–h) Short-axis myocardial delayed enhancement MR images show an absence of late contrast enhancement. (i, j) Postcontrast T1 mapping performed with an LL sequence in the horizontal long-axis plane shows the left ventricular endo- (red line) and epicardial (green line) contours, which are manually drawn. Thirty-two images were acquired throughout the cardiac cycle. (k) Graph shows the data obtained from LL T1 mapping, which were plotted with three-parameter curve fitting and used to calculate T1 times. x-axis = delay time, y-axis = signal intensity. (l, m) Postcontrast T1 mapping performed with a MOLLI sequence in the short-axis plane shows the left ventricular endo- (red line) and epicardial (green line) contours, which are manually drawn. All 11 images were acquired at the same time in end diastole. (n) Graph shows the data obtained from MOLLI T1 mapping, which were plotted with three-parameter curve fitting and used to calculate T1 times. MOLLI and LL sequences had similar T1 values for T1 times after administration of gadolinium contrast material. x-axis = delay time, y-axis = signal intensity.
Figure 8j
Figure 8j
T1 mapping performed with LL and MOLLI sequences in a 42-year-old man with mild asymmetric septal hypertrophy and mild to moderate systolic anterior motion of the mitral valve with provocation at echocardiography and a family history of hypertrophic cardiomyopathy. (a–d) Bright blood MR images obtained in the horizontal long-axis plane (a), vertical long-axis plane (b), five-chamber view (c), and short-axis plane (d) show that mid septal thickness reaches 1.3 cm in end diastole. (e–h) Short-axis myocardial delayed enhancement MR images show an absence of late contrast enhancement. (i, j) Postcontrast T1 mapping performed with an LL sequence in the horizontal long-axis plane shows the left ventricular endo- (red line) and epicardial (green line) contours, which are manually drawn. Thirty-two images were acquired throughout the cardiac cycle. (k) Graph shows the data obtained from LL T1 mapping, which were plotted with three-parameter curve fitting and used to calculate T1 times. x-axis = delay time, y-axis = signal intensity. (l, m) Postcontrast T1 mapping performed with a MOLLI sequence in the short-axis plane shows the left ventricular endo- (red line) and epicardial (green line) contours, which are manually drawn. All 11 images were acquired at the same time in end diastole. (n) Graph shows the data obtained from MOLLI T1 mapping, which were plotted with three-parameter curve fitting and used to calculate T1 times. MOLLI and LL sequences had similar T1 values for T1 times after administration of gadolinium contrast material. x-axis = delay time, y-axis = signal intensity.
Figure 8k
Figure 8k
T1 mapping performed with LL and MOLLI sequences in a 42-year-old man with mild asymmetric septal hypertrophy and mild to moderate systolic anterior motion of the mitral valve with provocation at echocardiography and a family history of hypertrophic cardiomyopathy. (a–d) Bright blood MR images obtained in the horizontal long-axis plane (a), vertical long-axis plane (b), five-chamber view (c), and short-axis plane (d) show that mid septal thickness reaches 1.3 cm in end diastole. (e–h) Short-axis myocardial delayed enhancement MR images show an absence of late contrast enhancement. (i, j) Postcontrast T1 mapping performed with an LL sequence in the horizontal long-axis plane shows the left ventricular endo- (red line) and epicardial (green line) contours, which are manually drawn. Thirty-two images were acquired throughout the cardiac cycle. (k) Graph shows the data obtained from LL T1 mapping, which were plotted with three-parameter curve fitting and used to calculate T1 times. x-axis = delay time, y-axis = signal intensity. (l, m) Postcontrast T1 mapping performed with a MOLLI sequence in the short-axis plane shows the left ventricular endo- (red line) and epicardial (green line) contours, which are manually drawn. All 11 images were acquired at the same time in end diastole. (n) Graph shows the data obtained from MOLLI T1 mapping, which were plotted with three-parameter curve fitting and used to calculate T1 times. MOLLI and LL sequences had similar T1 values for T1 times after administration of gadolinium contrast material. x-axis = delay time, y-axis = signal intensity.
Figure 8l
Figure 8l
T1 mapping performed with LL and MOLLI sequences in a 42-year-old man with mild asymmetric septal hypertrophy and mild to moderate systolic anterior motion of the mitral valve with provocation at echocardiography and a family history of hypertrophic cardiomyopathy. (a–d) Bright blood MR images obtained in the horizontal long-axis plane (a), vertical long-axis plane (b), five-chamber view (c), and short-axis plane (d) show that mid septal thickness reaches 1.3 cm in end diastole. (e–h) Short-axis myocardial delayed enhancement MR images show an absence of late contrast enhancement. (i, j) Postcontrast T1 mapping performed with an LL sequence in the horizontal long-axis plane shows the left ventricular endo- (red line) and epicardial (green line) contours, which are manually drawn. Thirty-two images were acquired throughout the cardiac cycle. (k) Graph shows the data obtained from LL T1 mapping, which were plotted with three-parameter curve fitting and used to calculate T1 times. x-axis = delay time, y-axis = signal intensity. (l, m) Postcontrast T1 mapping performed with a MOLLI sequence in the short-axis plane shows the left ventricular endo- (red line) and epicardial (green line) contours, which are manually drawn. All 11 images were acquired at the same time in end diastole. (n) Graph shows the data obtained from MOLLI T1 mapping, which were plotted with three-parameter curve fitting and used to calculate T1 times. MOLLI and LL sequences had similar T1 values for T1 times after administration of gadolinium contrast material. x-axis = delay time, y-axis = signal intensity.
Figure 8m
Figure 8m
T1 mapping performed with LL and MOLLI sequences in a 42-year-old man with mild asymmetric septal hypertrophy and mild to moderate systolic anterior motion of the mitral valve with provocation at echocardiography and a family history of hypertrophic cardiomyopathy. (a–d) Bright blood MR images obtained in the horizontal long-axis plane (a), vertical long-axis plane (b), five-chamber view (c), and short-axis plane (d) show that mid septal thickness reaches 1.3 cm in end diastole. (e–h) Short-axis myocardial delayed enhancement MR images show an absence of late contrast enhancement. (i, j) Postcontrast T1 mapping performed with an LL sequence in the horizontal long-axis plane shows the left ventricular endo- (red line) and epicardial (green line) contours, which are manually drawn. Thirty-two images were acquired throughout the cardiac cycle. (k) Graph shows the data obtained from LL T1 mapping, which were plotted with three-parameter curve fitting and used to calculate T1 times. x-axis = delay time, y-axis = signal intensity. (l, m) Postcontrast T1 mapping performed with a MOLLI sequence in the short-axis plane shows the left ventricular endo- (red line) and epicardial (green line) contours, which are manually drawn. All 11 images were acquired at the same time in end diastole. (n) Graph shows the data obtained from MOLLI T1 mapping, which were plotted with three-parameter curve fitting and used to calculate T1 times. MOLLI and LL sequences had similar T1 values for T1 times after administration of gadolinium contrast material. x-axis = delay time, y-axis = signal intensity.
Figure 8n
Figure 8n
T1 mapping performed with LL and MOLLI sequences in a 42-year-old man with mild asymmetric septal hypertrophy and mild to moderate systolic anterior motion of the mitral valve with provocation at echocardiography and a family history of hypertrophic cardiomyopathy. (a–d) Bright blood MR images obtained in the horizontal long-axis plane (a), vertical long-axis plane (b), five-chamber view (c), and short-axis plane (d) show that mid septal thickness reaches 1.3 cm in end diastole. (e–h) Short-axis myocardial delayed enhancement MR images show an absence of late contrast enhancement. (i, j) Postcontrast T1 mapping performed with an LL sequence in the horizontal long-axis plane shows the left ventricular endo- (red line) and epicardial (green line) contours, which are manually drawn. Thirty-two images were acquired throughout the cardiac cycle. (k) Graph shows the data obtained from LL T1 mapping, which were plotted with three-parameter curve fitting and used to calculate T1 times. x-axis = delay time, y-axis = signal intensity. (l, m) Postcontrast T1 mapping performed with a MOLLI sequence in the short-axis plane shows the left ventricular endo- (red line) and epicardial (green line) contours, which are manually drawn. All 11 images were acquired at the same time in end diastole. (n) Graph shows the data obtained from MOLLI T1 mapping, which were plotted with three-parameter curve fitting and used to calculate T1 times. MOLLI and LL sequences had similar T1 values for T1 times after administration of gadolinium contrast material. x-axis = delay time, y-axis = signal intensity.
Figure 9a
Figure 9a
The first published myocardial T1 maps, which were obtained with the LL technique at 0.08 T in 1988, show that precontrast T1 values were higher in a patient with lupus erythematosus (a) than they were in the control patient (b), a finding indicative of diffuse interstitial fibrosis. Each image in the T1 maps took about 5 minutes to acquire. (Reprinted, with permission, from reference .)
Figure 9b
Figure 9b
The first published myocardial T1 maps, which were obtained with the LL technique at 0.08 T in 1988, show that precontrast T1 values were higher in a patient with lupus erythematosus (a) than they were in the control patient (b), a finding indicative of diffuse interstitial fibrosis. Each image in the T1 maps took about 5 minutes to acquire. (Reprinted, with permission, from reference .)
Figure 10
Figure 10
Diagram shows a conventional 2D LL pulse sequence, in which a nonselective 180° inversion pulse (π) is applied, and repeated radiofrequency pulses (α) with a small flip angle are separated by a time (τ) and sample the longitudinal signal magnetization as it recovers to steady state. μ = undisturbed recovery period. (Adapted and reprinted, with permission, from reference .)
Figure 11
Figure 11
Graph shows the mean myocardial T1 time for each acquisition before and after (in 5-minute intervals) administration of contrast material with MOLLI (black) and LL (gray) sequences. For all postcontrast acquisitions, P < .001; for precontrast acquisitions, P = .26. (Reprinted, with permission, from reference .)
Figure 12a
Figure 12a
T1 mapping in a patient with myocardial infarction. (a) Short-axis IR-prepared delayed contrast-enhanced MR image shows subendocardial enhancement in the anteroseptal wall and the subendocardial (red line), subepicardial (green line), and blood pool (yellow line) contours. (b) Short-axis color-scale parametric map, created with a 12-minute contrast-enhanced MOLLI sequence with inline motion correction, shows the T1 color scale, which indicates the T1 times of the left ventricular myocardium and blood pool. (c) Short-axis color-scale T1 parametric map shows the contours for infarction (white arrow), perinfarction (red arrow), and remote myocardium (black arrow), as well as the color scale with the corresponding T1 times. Contours were manually drawn on the basis of abnormal signal intensity on delayed contrast-enhanced images. (Images courtesy of Marcelo Nacif, MD, PhD, Universidade Federal Fluminense, Niterói, Brazil.)
Figure 12b
Figure 12b
T1 mapping in a patient with myocardial infarction. (a) Short-axis IR-prepared delayed contrast-enhanced MR image shows subendocardial enhancement in the anteroseptal wall and the subendocardial (red line), subepicardial (green line), and blood pool (yellow line) contours. (b) Short-axis color-scale parametric map, created with a 12-minute contrast-enhanced MOLLI sequence with inline motion correction, shows the T1 color scale, which indicates the T1 times of the left ventricular myocardium and blood pool. (c) Short-axis color-scale T1 parametric map shows the contours for infarction (white arrow), perinfarction (red arrow), and remote myocardium (black arrow), as well as the color scale with the corresponding T1 times. Contours were manually drawn on the basis of abnormal signal intensity on delayed contrast-enhanced images. (Images courtesy of Marcelo Nacif, MD, PhD, Universidade Federal Fluminense, Niterói, Brazil.)
Figure 12c
Figure 12c
T1 mapping in a patient with myocardial infarction. (a) Short-axis IR-prepared delayed contrast-enhanced MR image shows subendocardial enhancement in the anteroseptal wall and the subendocardial (red line), subepicardial (green line), and blood pool (yellow line) contours. (b) Short-axis color-scale parametric map, created with a 12-minute contrast-enhanced MOLLI sequence with inline motion correction, shows the T1 color scale, which indicates the T1 times of the left ventricular myocardium and blood pool. (c) Short-axis color-scale T1 parametric map shows the contours for infarction (white arrow), perinfarction (red arrow), and remote myocardium (black arrow), as well as the color scale with the corresponding T1 times. Contours were manually drawn on the basis of abnormal signal intensity on delayed contrast-enhanced images. (Images courtesy of Marcelo Nacif, MD, PhD, Universidade Federal Fluminense, Niterói, Brazil.)
Figure 13a
Figure 13a
Use of regions of interest to derive T1 values in a patient with hypertrophic cardiomyopathy. Short-axis gray-scale parametric T1 maps obtained with MOLLI sequences and inline motion correction before (a) and 12 minutes after (b) administration of contrast material show the regions of interest (circle) and T1 times. Typically, postcontrast T1 times are 450–475 msec. In this case, the T1 time was 396 msec, a finding indicative of diffuse myocardial fibrosis, which, when associated with hypertrophic cardiomyopathy, may be seen at cardiac MR imaging and is associated with left ventricular diastolic dysfunction.
Figure 13b
Figure 13b
Use of regions of interest to derive T1 values in a patient with hypertrophic cardiomyopathy. Short-axis gray-scale parametric T1 maps obtained with MOLLI sequences and inline motion correction before (a) and 12 minutes after (b) administration of contrast material show the regions of interest (circle) and T1 times. Typically, postcontrast T1 times are 450–475 msec. In this case, the T1 time was 396 msec, a finding indicative of diffuse myocardial fibrosis, which, when associated with hypertrophic cardiomyopathy, may be seen at cardiac MR imaging and is associated with left ventricular diastolic dysfunction.
Figure 14a
Figure 14a
ShMOLLI in a patient with arrhythmogenic right ventricular cardiomyopathy and dysplasia. (a) Short-axis T1 map obtained with a ShMOLLI sequence 12 minutes after administration of contrast material shows left ventricular endo- (red line) and epicardial (green line) contours, which were manually drawn, and the region of interest, which was placed in the left ventricular blood pool. (b) T1 maps obtained with an LL sequence show the left ventricular endo- (red line) and epicardial (green line) contours. Eight images, with varying TI times, were obtained. (c) Graph shows the data obtained from ShMOLLI T1 mapping, which were plotted with three-parameter curve fitting and used to calculate T1 times, which, in this patient, are decreased.
Figure 14b
Figure 14b
ShMOLLI in a patient with arrhythmogenic right ventricular cardiomyopathy and dysplasia. (a) Short-axis T1 map obtained with a ShMOLLI sequence 12 minutes after administration of contrast material shows left ventricular endo- (red line) and epicardial (green line) contours, which were manually drawn, and the region of interest, which was placed in the left ventricular blood pool. (b) T1 maps obtained with an LL sequence show the left ventricular endo- (red line) and epicardial (green line) contours. Eight images, with varying TI times, were obtained. (c) Graph shows the data obtained from ShMOLLI T1 mapping, which were plotted with three-parameter curve fitting and used to calculate T1 times, which, in this patient, are decreased.
Figure 14c
Figure 14c
ShMOLLI in a patient with arrhythmogenic right ventricular cardiomyopathy and dysplasia. (a) Short-axis T1 map obtained with a ShMOLLI sequence 12 minutes after administration of contrast material shows left ventricular endo- (red line) and epicardial (green line) contours, which were manually drawn, and the region of interest, which was placed in the left ventricular blood pool. (b) T1 maps obtained with an LL sequence show the left ventricular endo- (red line) and epicardial (green line) contours. Eight images, with varying TI times, were obtained. (c) Graph shows the data obtained from ShMOLLI T1 mapping, which were plotted with three-parameter curve fitting and used to calculate T1 times, which, in this patient, are decreased.
Figure 15
Figure 15
Chart shows the calculation of ECV, in which a reciprocal of the signal in each pixel (1/T1) is used to generate an R1 map. The precontrast R1 map is subtracted from the postcontrast R1 map to generate a ΔR1 map. A ΔR1 map of the blood pool (ΔR1blood) is measured by placing a region of interest in the left ventricular blood pool. To calculate ECV, ΔR1 map pixel values are multiplied by one, with the hematocrit level subtracted, and then divided by the mean ΔR1blood. The final result is a parametric map that displays the pixel-by-pixel ECV values, which are converted into signal intensity by the software. (Adapted and reprinted, with permission, from reference .)

References

    1. Kwong RY, Chan AK, Brown KA, et al. Impact of unrecognized myocardial scar detected by cardiac magnetic resonance imaging on event-free survival in patients presenting with signs or symptoms of coronary artery disease. Circulation 2006;113(23):2733–2743. - PubMed
    1. Kwong RY, Sattar H, Wu H, et al. Incidence and prognostic implication of unrecognized myocardial scar characterized by cardiac magnetic resonance in diabetic patients without clinical evidence of myocardial infarction. Circulation 2008;118(10):1011–1020. - PMC - PubMed
    1. Assomull RG, Prasad SK, Lyne J, et al. Cardiovascular magnetic resonance, fibrosis, and prognosis in dilated cardiomyopathy. J Am Coll Cardiol 2006;48(10):1977–1985. - PubMed
    1. Dweck MR, Joshi S, Murigu T, et al. Midwall fibrosis is an independent predictor of mortality in patients with aortic stenosis. J Am Coll Cardiol 2011; 58(12):1271–1279. - PubMed
    1. Becker AE, Heijmans CD, Essed CE. Chronic non-ischaemic congestive heart disease and endomyocardial biopsies: worth the extra? Eur Heart J 1991; 12(2):218–223. - PubMed