. 2014 Mar 12:15:187.
doi: 10.1186/1471-2164-15-187.

Paleo-evolutionary plasticity of plant disease resistance genes

Affiliations

Paleo-evolutionary plasticity of plant disease resistance genes

Rongzhi Zhang et al. BMC Genomics. .

Abstract

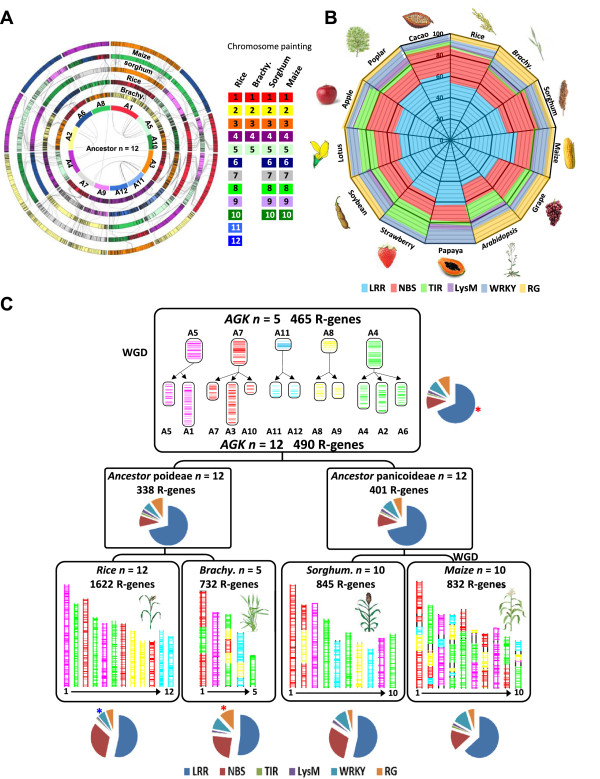
Background: The recent access to a large set of genome sequences, combined with a robust evolutionary scenario of modern monocot (i.e. grasses) and eudicot (i.e. rosids) species from their founder ancestors, offered the opportunity to gain insights into disease resistance genes (R-genes) evolutionary plasticity.

Results: We unravel in the current article (i) a R-genes repertoire consisting in 7883 for monocots and 15758 for eudicots, (ii) a contrasted R-genes conservation with 23.8% for monocots and 6.6% for dicots, (iii) a minimal ancestral founder pool of 384 R-genes for the monocots and 150 R-genes for the eudicots, (iv) a general pattern of organization in clusters accounting for more than 60% of mapped R-genes, (v) a biased deletion of ancestral duplicated R-genes between paralogous blocks possibly compensated by clusterization, (vi) a bias in R-genes clusterization where Leucine-Rich Repeats act as a 'glue' for domain association, (vii) a R-genes/miRNAs interome enriched toward duplicated R-genes.

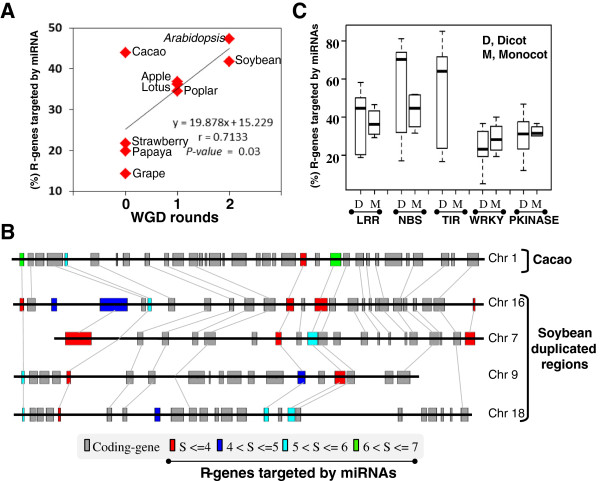
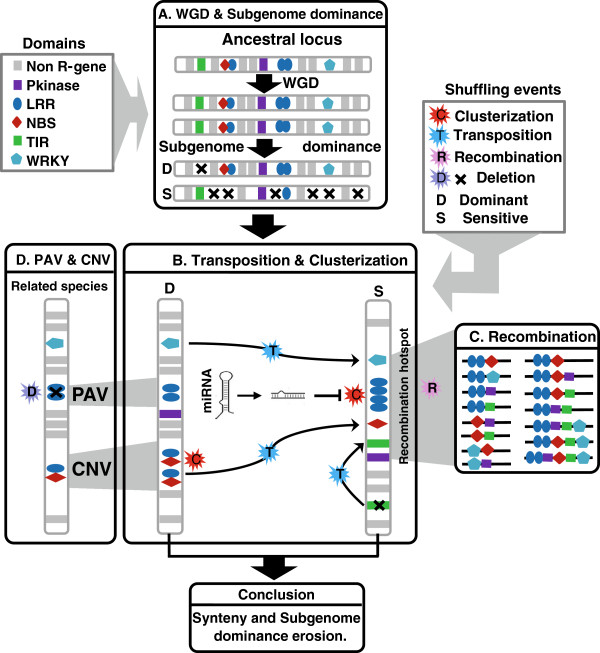
Conclusions: Together, our data may suggest that R-genes family plasticity operated during plant evolution (i) at the structural level through massive duplicates loss counterbalanced by massive clusterization following polyploidization; as well as at (ii) the regulation level through microRNA/R-gene interactions acting as a possible source of functional diploidization of structurally retained R-genes duplicates. Such evolutionary shuffling events leaded to CNVs (i.e. Copy Number Variation) and PAVs (i.e. Presence Absence Variation) between related species operating in the decay of R-genes colinearity between plant species.


Figures

Figure 1
Figure 1
R-genes conservation and evolution in plants. (A) Grass genome synteny is illustrated as concentric circles. The chromosomes are highlighted with a color code (right) that illuminates the n = 12 monocot ancestral genome structure (inner circle A1 to A12). Any radius of the circle shows orthologous chromosomes between Brachypodium, rice, sorghum, and maize genomes. Maize genome is depicted as a double circle originating from the maize-specific recent WGD. Colinear R-genes are linked with black lines between circles, and ancestral duplicated R-genes are linked with black lines at the center of the circle. (B) R-genes content from 13 plant genomes including monocots (rice, Brachypodium, sorghum, and maize) and eudicots (Arabidopsis, Grape, Cacao, Papaya, Strawberry, Poplar, Lotus, Apple, and Soybean). The color code (bottom) highlights the R-gene classes investigated (LRR, NBS, TIR, LysM, RG). (C) Evolutionary scenario of R-genes in monocots. The modern grass genome structures (bottom) are depicted with a five-color code that illuminates their relationship with the n = 5 (A5, A7, A11, A8, A4) and n = 12 (A1 to A12) ancestors (top), according to Murat et al. [67]. The characterized R-genes are illustrated as vertical bars on the chromosomes of modern and ancestral genomes. The percentages of R-gene classes (LRR, NBS, TIR, LysM, RG, highlighted with the color code legend at the bottom) are shown with circular distributions for the four monocot genomes (bottom), the rice/Brachypodium and sorghum/maize ancestral genome intermediates (center), as well as for the ancestral karyotype (top). Statistically enriched and impoverished R-gene families are illustrated respectively with red and blue dots on the circular distributions.
Figure 2
Figure 2
R-genes conservation between duplicated blocks in grasses. (A) Illustration at the top of the grass ancestral genomes with n = 5 (A5, A7, A11, A8, A4) paleoduplicated into n = 12 (A1 to A12) defining 7 shared duplicated blocks (black arrows). The number of conserved R-genes (y-axis) between duplicated chromosomes (x-axis) in modern grasses is illustrated as box plots (formula image 
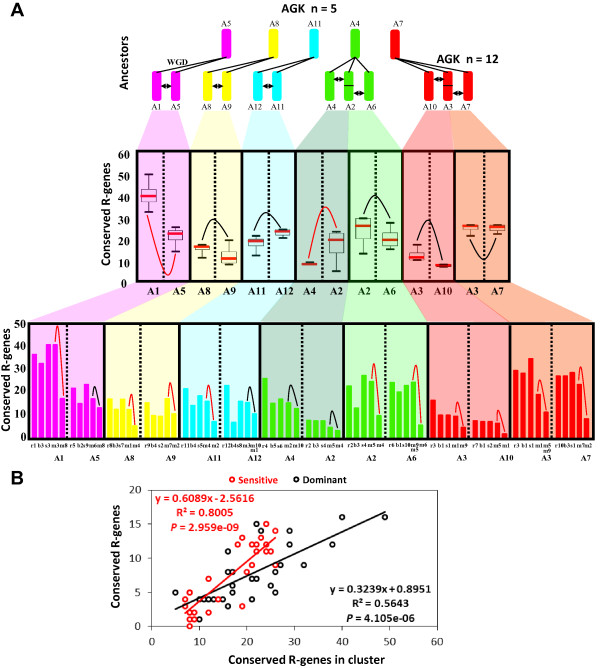
illustrates non-significant differences; formula image illustrates significant differences based on permutation test with P-value < 0.05, see Methods section). Distribution pattern of conserved R-genes in modern chromosome pairs is shown in rice, Brachypodium, sorghum and maize. (B) Illustration of the correlation between the number of observed R-genes in cluster (x-axis) and the total number of conserved R-genes (y-axis) characterized in the sensitive (red dot and curve) and dominant (black dot and curve) chromosomal blocks.
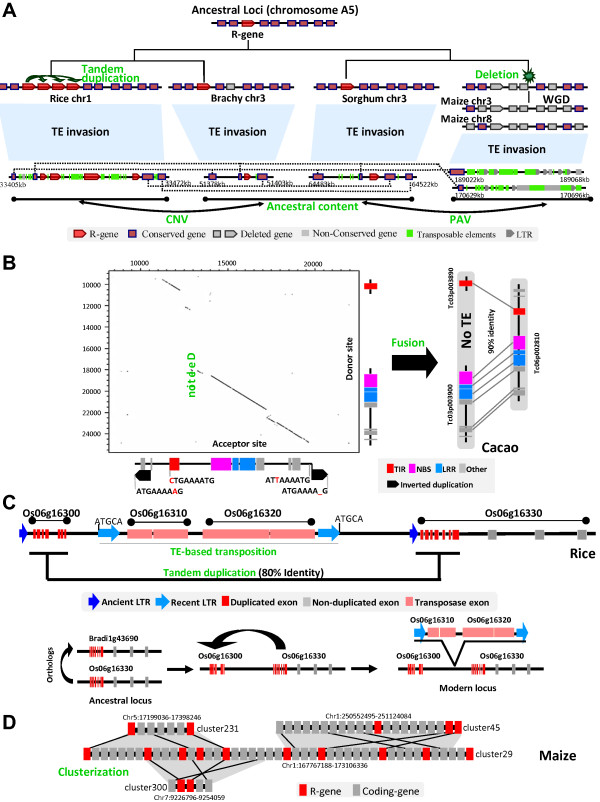
Figure 3
Figure 3
Different sources of R-genes plasticity in plants. (A) Evolutionary history of a locus located on the ancestral chromosome A5 showing R-gene conservation as well as CNV and PAV between rice, Brachypodium, sorghum and maize. Conserved genes, non-conserved genes, deleted genes and transposable elements are illustrated according to the legend at the bottom. Dotted black lines link orthologous genes between modern loci at the bottom. The ancestral gene content is illustrated at the top. (B) Illustration of an example of R-gene fusion in cacao after duplication. The dotplot illustrates the two copy-paste regions flanked by TSD (Target Site Duplication as black arrows) motifs and repeated sequence motifs (ctgaaaatg/attaaaatg). R-genes (TIR, NBS, LRR) classes are illustrated according to the color code at the bottom. (C) Illustration of a R-gene (Os06g16330) partially duplicated (Os06g16300) in rice separated by a transposition event (Os06g16310- Os06g16320). The reconstructed evolutionary scenario is illustrated based on a color code illuminating repeat (ancient, recent) and gene (duplicated, non-duplicated, transposase) content. (D) Duplicated R-gene cluster plasticity in maize. One central R-gene cluster (chromosome 1) consisting in R-genes (red) and non R-genes (grey) is duplicated on homeoelogous regions (chromosomes 1-5-7) with distinct R-gene contents.
Figure 4
Figure 4
R-genes/miRNAs interactome in plants. (A) Illustration of the percentage of R-genes targeted by miRNA in dicots species classified according the number of experienced WGDs (x-axis). The regression curve, correlation and associated P-value are mentioned. (B) Illustration of a micro-synteny locus between cacao (one region) and soybean (four duplicated regions) harboring R-genes targeted by miRNA (according to the number of sequence mismatches between miRNA and R-genes from 4 to 7 identified as miRNA target score and highlighted with a color code at the bottom). Grey bars represent non R-genes. (C) Illustration of the percentage of R-genes targeted by miRNA (y-axis) in dicots (D) and monocots (M) species classified according to the investigated R-domains (LRR, NBS, TIR, WRKY, Pkinase; x-axis).
Figure 5
Figure 5
Evolutionary model of R-genes in plant genomes. Major conclusions from the current study are schematically illustrated in four panels highlighting (A) biased deletion of R-genes between duplicated blocks (D for dominant and S for sensitive) after whole genome duplication; (B) R-genes shuffling via transposition as well as clusterization involving R-gene/miRNA interactions; (C) R-genes domains rearrangement in clusters considered as recombination hotspots; (D) Presence/Absence Variation (PAV) and Copy Number Variation (CNV) between related species. R-gene classes are illustrated according to the color code at the top left. Shuffling events are illustrated through the color code at the top right.

References

    1. Glazebrook J. Contrasting mechanisms of defense against biotrophic and necrotrophic pathogens. Annu Rev Phytopathol. 2005;43:205–227. doi: 10.1146/annurev.phyto.43.040204.135923. - DOI - PubMed
    1. Pallas V, Garcia JA. How do plant viruses induce disease? Interactions and interference with host components. J Gen Virol. 2011;92(Pt 12):2691–2705. - PubMed
    1. Soriano IR, Riley IT, Potter MJ, Bowers WS. Phytoecdysteroids: a novel defense against plant-parasitic nematodes. J Chem Ecol. 2004;30(10):1885–1899. - PubMed
    1. Choy A, Roy CR. Autophagy and bacterial infection: an evolving arms race. Trends Microbiol. 2013;21(9):451–456. doi: 10.1016/j.tim.2013.06.009. - DOI - PMC - PubMed
    1. Chisholm ST, Coaker G, Day B, Staskawicz BJ. Host-microbe interactions: shaping the evolution of the plant immune response. Cell. 2006;124(4):803–814. doi: 10.1016/j.cell.2006.02.008. - DOI - PubMed

Publication types

LinkOut - more resources