. 2014 Mar 11;16(2):R24.
doi: 10.1186/bcr3623.

Fibroblast growth factor receptor splice variants are stable markers of oncogenic transforming growth factor β1 signaling in metastatic breast cancers

Fibroblast growth factor receptor splice variants are stable markers of oncogenic transforming growth factor β1 signaling in metastatic breast cancers

Michael K Wendt et al. Breast Cancer Res. .

Abstract

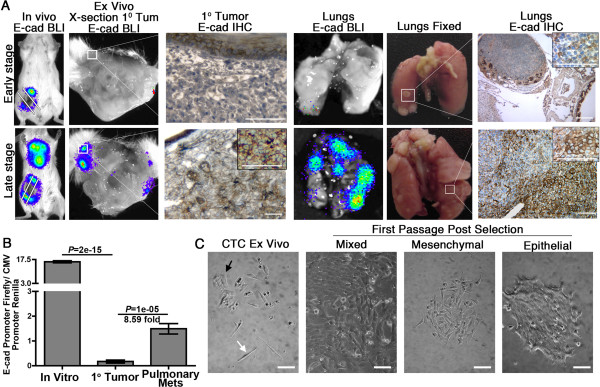
Introduction: Epithelial-mesenchymal transition (EMT) and mesenchymal-epithelial transition (MET) facilitate breast cancer (BC) metastasis; however, stable molecular changes that result as a consequence of these processes remain poorly defined. Therefore, with the hope of targeting unique aspects of metastatic tumor outgrowth, we sought to identify molecular markers that could identify tumor cells that had completed the EMT:MET cycle.

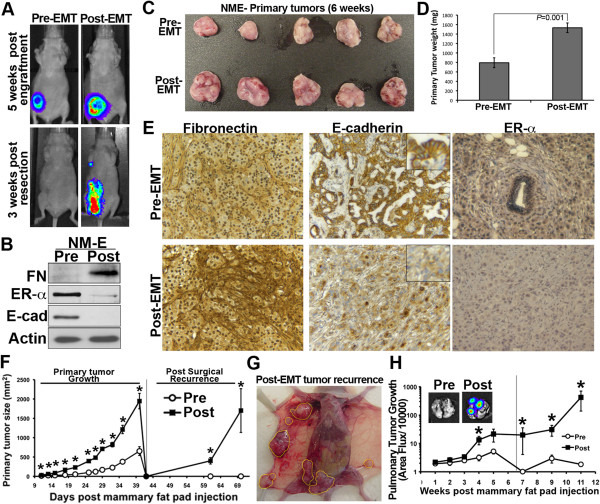
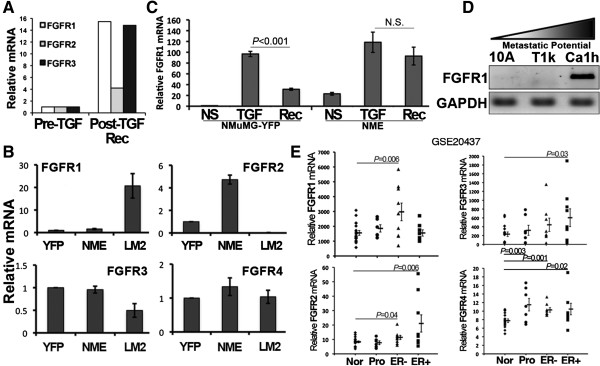
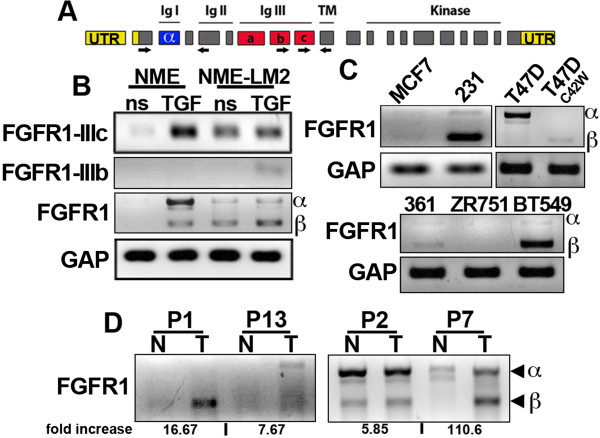
Methods: An in vivo reporter system for epithelial cadherin (E-cad) expression was used to quantify its regulation in metastatic BC cells during primary and metastatic tumor growth. Exogenous addition of transforming growth factor β1 (TGF-β1) was used to induce EMT in an in situ model of BC. Microarray analysis was employed to examine gene expression changes in cells chronically treated with and withdrawn from TGF-β1, thus completing one full EMT:MET cycle. Changes in fibroblast growth factor receptor type 1 (FGFR1) isoform expression were validated using PCR analyses of patient-derived tumor tissues versus matched normal tissues. FGFR1 gene expression was manipulated using short hairpin RNA depletion and cDNA rescue. Preclinical pharmacological inhibition of FGFR kinase was employed using the orally available compound BGJ-398.

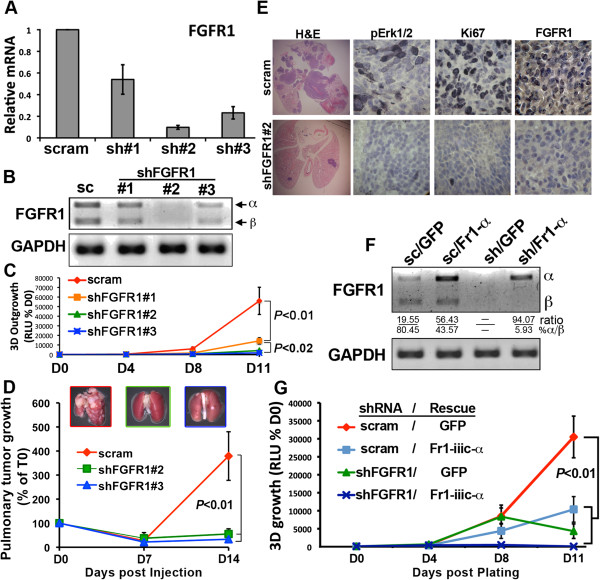
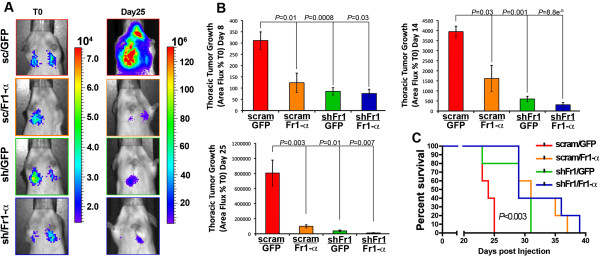
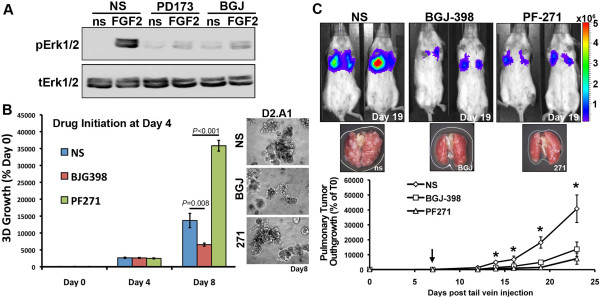
Results: Metastatic BC cells undergo spontaneous downregulation of E-cad during primary tumor growth, and its expression subsequently returns following initiation of metastatic outgrowth. Exogenous exposure to TGF-β1 was sufficient to drive the metastasis of an otherwise in situ model of BC and was similarly associated with a depletion and return of E-cad expression during metastatic progression. BC cells treated and withdrawn from TGF-β stably upregulate a truncated FGFR1-β splice variant that lacks the outermost extracellular immunoglobulin domain. Identification of this FGFR1 splice variant was verified in metastatic human BC cell lines and patient-derived tumor samples. Expression of FGFR1-β was also dominant in a model of metastatic outgrowth where depletion of FGFR1 and pharmacologic inhibition of FGFR kinase activity both inhibited pulmonary tumor outgrowth. Highlighting the dichotomous nature of FGFR splice variants and recombinant expression of full-length FGFR1-α also blocked pulmonary tumor outgrowth.

Conclusion: The results of our study strongly suggest that FGFR1-β is required for the pulmonary outgrowth of metastatic BC. Moreover, FGFR1 isoform expression can be used as a predictive biomarker for therapeutic application of its kinase inhibitors.


Figures

Figure 1
Figure 1
Spontaneously metastatic breast cancer cells dynamically regulate epithelial cadherin during in vivo primary and metastatic tumor growth. (A) Bioluminescence imaging (BLI) of metastatic 4T1 cells expressing cytomegalovirus (CMV)-driven Renilla luciferase and firefly luciferase driven by the epithelial cadherin (E-cad) promoter. Cells were engrafted onto the mammary fat pads of BALB/c mice, and qualitative E-cad promoter activity (for example, luciferin-derived bioluminescence) was monitored in vivo and ex vivo. E-cad bioluminescence was spatially correlated with E-cad protein expression as determined by IHC. Bars indicate 40x, 100x and 400x magnifications. (B) E-cad promoter activity (for example, luciferin-derived bioluminescence) was quantified by normalization to CMV promoter activity (for example, coelenterazine-derived bioluminescence) in in vitro cultured cells and ex vivo tissues derived from primary tumors and their late-stage metastases (Mets). Data represent ten samples (n = 10, ±SE) derived from five individual mice bearing primary and metastatic tumors, resulting in the indicated P values. (C) Circulating tumor cells (CTCs) were isolated from the blood of 4T1 tumor-bearing mice and selected for resistance to Zeocin. Photomicrographs show the antibiotic-resistant CTCs (CTC ex vivo). The morphologically epithelial cells (black arrow) were physically isolated from the mesenchymal cells (white arrow) and further subcultured as separate populations of mesenchymal-like and epithelial-like cells as indicated. Bars indicate a 100x magnification.
Figure 2
Figure 2
Transforming growth factor β treatment is sufficient to induce postsurgical recurrence and pulmonary metastasis. (A) Normal mammary epithelial (NME) cells were left untreated (before transforming growth factor treatment (pre-TGF)) or treated with TGF-β1 (post-TGF) and engrafted (2 × 106 cells/mouse) onto the mammary fat pad, at which point primary tumor growth was monitored by bioluminescence. Five weeks after engraftment of pre- and post-TGF NME cells, the primary tumors were surgically removed and tumor recurrence was similarly monitored by bioluminescence imaging. Shown are two representative mice from each experimental cohort, both before and 3 weeks after surgical resection of the primary tumor. (B) NME cells were treated with TGF-β1 (Post) as described in (A) and monitored for expression of the mesenchymal marker fibronectin (FN) and the marker epithelial cadherin (E-cad). Estrogen receptor α (ERα) was potently downregulated in NME cells following TGF-β treatment. (C) Photograph showing ex vivo pre- and post-TGF primary tumors following surgical resection demonstrating complete and intact primary tumor excision. (D) The average weight (±SE) of pre- and post-TGF primary tumors shown in (C) and the indicated P value. (E) Pre- and post-TGF primary tumors were analyzed by immunohistochemistry for the in vitro markers described in Panel B. All images were taken at 100x magnification and insets were taken at 400x magnification. (F) Growth of pre- and post-TGF NME primary and recurrent tumors were monitored using digital caliper measurements (n=5 mice/group). Vertical line indicates time of primary tumor resection. Data are the mean (±SE) tumor size for each group . *P < 0.05. (G) Photograph of a representative mouse 3 weeks after resection of a post-TGF NME tumor. Yellow outlines show widespread recurrent tumor formation. As shown in (A), mice bearing pre-TGF NME tumors failed to form recurrent tumors. (H)  Pulmonary metastasis of pre- and post-TGF NME tumors was quantified by bioluminescence. Line indicates time of primary tumor resection. Inset: Bioluminescent images of ex vivo lungs from representative mice bearing pre- and post-TGF NME tumors. Data are the mean (±SE) area flux values for each group. *P < 0.05 (n = 5 mice/group).
Figure 3
Figure 3
Upregulation of fibroblast growth factor receptor type 1 is stably maintained during oncogenic transforming growth factor β signaling. (A) Normal mammary epithelial (NME) cells were left untreated (before transforming growth factor treatment (pre-TGF)) or treated and allowed to recover from exogenous TGF-β1 treatment (post-TGF-Rec) as described in the Methods section. Global gene expression was assessed by microarray analyses. Data are results of RT-PCR analysis confirming stable upregulation of fibroblast growth factors 1 through 3 (FGFR1 to FGFR3) following TGF-β1 treatment and withdrawal. (B) Real-time PCR analyses showing the differential expression of FGFR1 to FGFR4 in control yellow fluorescent protein (YFP), nonmetastatic (NME) and lung metastatic (LM2) cell lines derived from the normal murine mammary gland (NMuMG) cells. (C) Control NMuMG (YFP) and NME cells were not stimulated (NS), stimulated with TGF-β1 (5 ng/ml) for 48 hours (TGF) and subsequently recovered for an additional 48 hours without exogenous ligand (Rec). Expression of FGFR1 was analyzed by real-time RT-PCR. Data in panels B and C are the mean expression values (±SD) of three independent experiments, resulting in the indicated P-values. (D)  Human MCF-10A-derived breast cancer (BC) cells of increasing metastatic potential were analyzed by RT-PCR for their expression of FGFR1. Glyceraldehyde 3-phosphate dehydrogenase (GAPDH) served as a loading control. Data are representative of three independent experiments. (E)In silico analyses of the Gene Expression Omnibus data set [GEO:GSE20437] demonstrating significant increases in FGFR1 to FGFR4 in prophylactically removed breast tissue (Pro), as well as in ER-negative (ER-) and ER-positive (ER+) tumor samples, as compared to a cohort of normal (Nor) breast tissue samples. Data are the individual values for each sample resulting in the indicated mean values (±SE) and P values.
Figure 4
Figure 4
The β isoform of the fibroblast growth factor receptor type 1 is selected for in increasingly metastatic cells and can be readily identified in patient tumor samples. (A) Schematic representation the FGFR1 transcript depicting the coding regions for the immunoglobulin (Ig), transmembrane (TM), and kinase domains. The location of the unique IIIb/IIIc primer sets (arrows) and the flanking primer set detecting the inclusion or exclusion of the α exon (arrows) are also indicated. (B) Expression of FGFR1 isoforms depicted in (A) were analyzed by RT-PCR in the nonmetastatic normal mammary epithelial (NME) cells and their lung metastatic (LM) and isogenic NME-LM2 counterparts before (ns) and after a 48-hour treatment with 5 ng/ml transforming growth factor β (TGF). (C) Luminal MCF-7, T47D, MDA-MB-361 and ZR-75-1 and basal MDA-MB-231 and BT549 human breast cancer cells were analyzed for inclusion or exclusion of the α exon of FGFR1. The estrogen-independent T47D-C42W cells were also analyzed. Data in (B) and (C) are representative of three independent experiments. (D) Four of the patient tumor samples (T; patients 1, 2, 7 and 13 (P1, P2, P7 and P13, respectively) that demonstrated upregulation of FGFR1 as compared to their matched normal mammary tissues (N) (Additional file 7: Table S4) were further analyzed for expression of the α versus β isoforms of FGFR1. The fold increase in total FGFR1 expression as determined by real-time PCR analysis that was normalized to glyceraldehyde 3-phosphate dehydrogenase (GAP) is indicated.
Figure 5
Figure 5
Depletion of fibroblast growth factor receptor type 1 inhibits pulmonary tumor outgrowth. (A) Real-time PCR analysis of fibroblast growth factor receptor type 1 (FGFR1) in D2.A1 cells expressing a nontargeting control short hairpin RNA (shRNA; scram) or three unique shRNA sequences targeting FGFR1 (sh#1 to sh#3). Data are the mean (±SD) of three independent experiments. (B) RT-PCR analysis of D2.A1 cells expressing the FGFR1 shRNA targeting sequences as described in (A). Primers used flank the α exon of FGFR1 and thus depict inclusion (α) or exclusion (β) of this exon. GAPDH, Glyceraldehyde 3-phosphate dehydrogenase; sc, scrambled short hairpin RNA. (C) Three-dimensional outgrowth of the FGFR1-depleted D2.A1 cells described in (A) and (B) was quantified by bioluminescence over the course of 11 days (D0 to D11). Data are the means (±SE) of two independent experiments completed in triplicate, resulting in the indicated P value. RLU, Relative light units. (D) D2.A1 cells expressing FGFR1 shRNAs #2 or #3 were injected into the lateral tail vein of female BALB/c mice, and pulmonary tumor formation was quantified by bioluminescence. Data are the mean (±SE) area flux values at the indicated time points expressed as a percentage of the injected value (% of T0; P < 0.01; n = 5 mice/group). Insets: images of representative lungs 21 days after tail vein injection with the indicated cells. (E) Pulmonary tissues from mice injected with control (scram) and FGFR1-depleted (shFr1#2) D2.A1 cells were stained with hematoxylin and eosin (H&E) or analyzed by immunohistochemistry for phosphorylation of extracellular signal-regulated kinases 1 and 2 (pErk1/2), the proliferation marker Ki67 or FGFR1. H&E images were taken at a 1x magnification, while all immunohistochemistry images were taken at a 400x magnification. (F) RT-PCR analysis of D2.A1 cells expressing a scrambled shRNA (sc) or the #2 shRNA targeting murine FGFR1 (sh). Depletion of endogenous FGFR1 in these cells was rescued by expression of a nontargeted human full-length form of FGFR1-α-IIIc (Fr1-α) or green fluorescent protein (GFP) as a control. The relative ratio of α to β FGFR1 transcripts is shown. (G) Three-dimensional outgrowth of the FGFR1-depleted and rescued D2.A1 cells described in (C) was quantified by bioluminescence. Data are the mean (±SE) of three independent experiments completed in triplicate, resulting in the indicated P value.
Figure 6
Figure 6
Expression of fibroblast growth factor receptor type 1, α isoform, has a dominant inhibitory affect during pulmonary tumor formation. (A) D2.A1 cells were constructed to express a scrambled short hairpin (shRNA; sc or scram) or the #2 shRNA targeting murine fibroblast growth factor receptor type 1 (FGFR1; sh or shFr1). Depletion of endogenous FGFR1 in these cells was rescued with a nontargeted human full-length form of the third (III) extracellular immunoglobulin (III-Ig) domain of the α isoform of FGFR1 (FGFR1-α-IIIc; Fr1-α) or green fluorescent protein (GFP) as a control. These cells (5 × 105) were injected into the lateral tail vein of female BALB/c mice. Shown are representative bioluminescence images of mice from each group at the time of injection (T0) and 25 days later (day 25). (B) Bioluminescent quantification at the indicated time points for the cohorts described in (A). Data are the mean (±SE) thoracic area flux values normalized to the injected values, resulting in the indicated P values (n = 5 mice per group). (C) Survival analysis of the cohorts described in (A) resulting in at least the indicated P value (n = 5 mice per group).
Figure 7
Figure 7
Therapeutic targeting of fibroblast growth factor receptor kinase activity delays the outgrowth of established pulmonary tumors. (A) Metastatic D2.A1 cells were grown under three-dimensional organotypic conditions for 4 days and not stimulated (NS) or pretreated with fibroblast growth factor receptor (FGFR) kinase inhibitor PD173074 (PD173) or BGJ398 (BGJ) for 6 hours prior to being not stimulated (ns) or stimulated with FGF2 for 30 minutes, at which point the cells were analyzed by immunoblotting for phosphorylated and total extracellular signal-regulated kinases 1 and 2 (pErk1/2 and tErk1/2, respectively). (B) D2.A1 tumor organoids were established for 4 days under three-dimensional culture conditions, at which point the tumor organoids were treated with BGJ398 (1 μM) or PF271 (1 μM). Data are the bioluminescence values normalized to the plated value and are the mean (±SE) of two independent experiments completed in triplicate, resulting in the indicated P values. Inset: Photomicrographs (100x magnification) of the D2.A1 three-dimensional tumor organoids 4 days after initiation of treatment with the indicated inhibitors. (C) D2.A1 cells were injected into the lateral tail vein of female BALB/c mice and allowed to establish pulmonary tumors for 7 days, at which point the mice were randomized and split into the three cohorts that received vehicle, BGJ398 or PF271 (50 mg/kg) daily via oral gavage (arrow indicates treatment initiation). Pulmonary tumor outgrowth was monitored by bioluminescence at the indicated time points (n = 5 mice per group). Bioluminescent images and ex vivo photomicrographs show the lungs from representative mice in each treatment group. Data are the mean (±SE) pulmonary bioluminescence values at the indicated time points relative to the injected value (% of D0), *P<0.05.

Similar articles

Cited by

References

    1. Korpal M, Ell BJ, Buffa FM, Ibrahim T, Blanco MA, Celià-Terrassa T, Mercatali L, Khan Z, Goodarzi H, Hua Y, Wei Y, Hu G, Garcia BA, Ragoussis J, Amadori D, Harris AL, Kang Y. Direct targeting of Sec23a by miR-200 s influences cancer cell secretome and promotes metastatic colonization. Nat Med. 2011;17:1101–1108. doi: 10.1038/nm.2401. - DOI - PMC - PubMed
    1. Wendt MK, Taylor MA, Schiemann BJ, Schiemann WP. Down-regulation of epithelial cadherin is required to initiate metastatic outgrowth of breast cancer. Mol Biol Cell. 2011;22:2423–2435. doi: 10.1091/mbc.E11-04-0306. - DOI - PMC - PubMed
    1. Hugo H, Ackland ML, Blick T, Lawrence MG, Clements JA, Williams ED, Thompson EW. Epithelial–mesenchymal and mesenchymal–epithelial transitions in carcinoma progression. J Cell Physiol. 2007;213:374–383. doi: 10.1002/jcp.21223. - DOI - PubMed
    1. Pinto CA, Widodo E, Waltham M, Thompson EW. Breast cancer stem cells and epithelial mesenchymal plasticity: implications for chemoresistance. Cancer Lett. 2013;341:56–62. doi: 10.1016/j.canlet.2013.06.003. - DOI - PubMed
    1. Wendt MK, Smith JA, Schiemann WP. Transforming growth factor-β-induced epithelial–mesenchymal transition facilitates epidermal growth factor-dependent breast cancer progression. Oncogene. 2010;29:6485–6498. doi: 10.1038/onc.2010.377. - DOI - PMC - PubMed

Publication types

MeSH terms

Associated data