

Genome-wide investigation and expression analysis suggest diverse roles and genetic redundancy of Pht1 family genes in response to Pi deficiency in tomato
- PMID: 24618087
- PMCID: PMC4007770
- DOI: 10.1186/1471-2229-14-61
Genome-wide investigation and expression analysis suggest diverse roles and genetic redundancy of Pht1 family genes in response to Pi deficiency in tomato
Abstract
Background: Phosphorus (P) deficiency is one of the major nutrient stresses limiting plant growth. The uptake of P by plants is well considered to be mediated by a number of high-affinity phosphate (Pi) transporters belonging to the Pht1 family. Although the Pht1 genes have been extensively identified in several plant species, there is a lack of systematic analysis of the Pht1 gene family in any solanaceous species thus far.
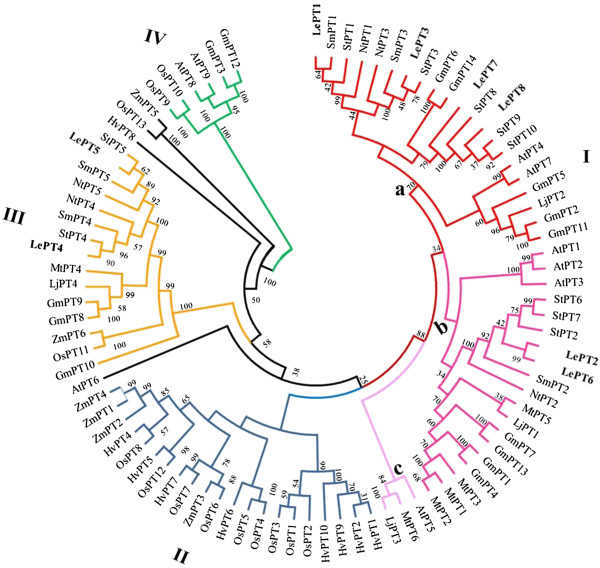
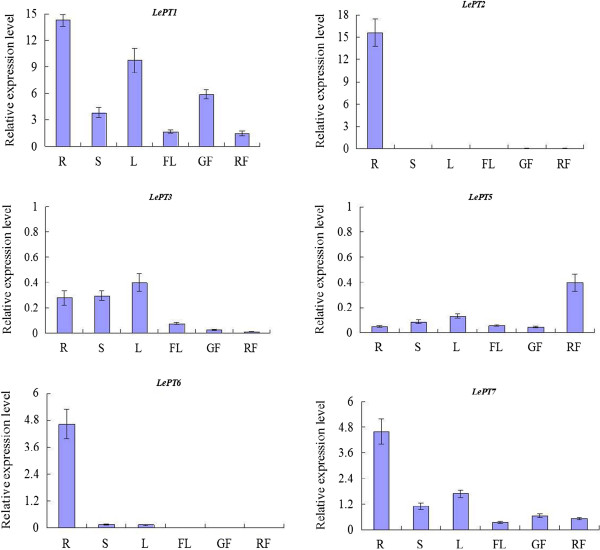
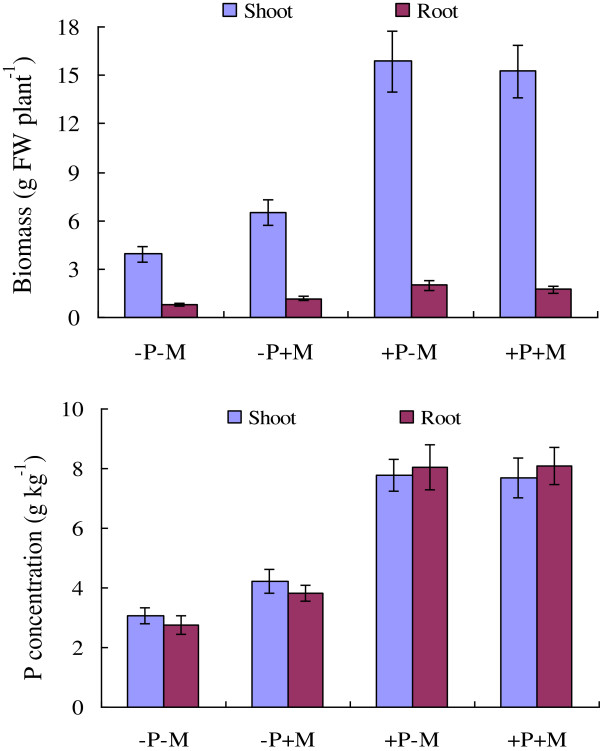
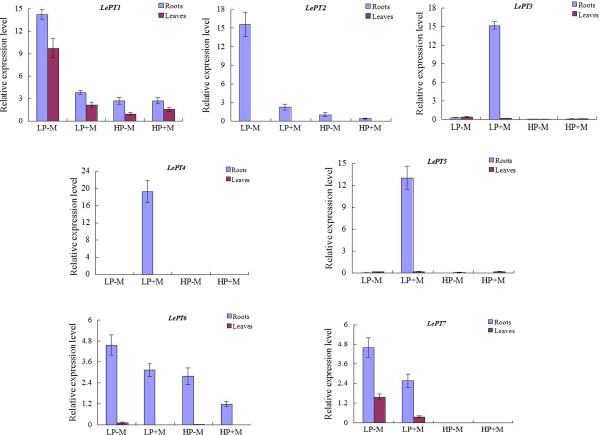
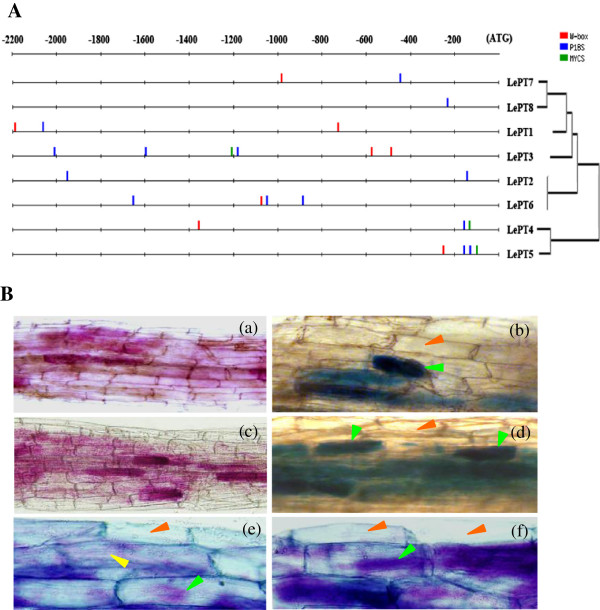
Results: Here, we report the genome-wide analysis, phylogenetic evolution and expression patterns of the Pht1 genes in tomato (Solanum lycopersicum). A total of eight putative Pht1 genes (LePT1 to 8), distributed on three chromosomes (3, 6 and 9), were identified through extensive searches of the released tomato genome sequence database. Chromosomal organization and phylogenetic tree analysis suggested that the six Pht1 paralogues, LePT1/3, LePT2/6 and LePT4/5, which were assigned into three pairs with very close physical distance, were produced from recent tandem duplication events that occurred after Solanaceae splitting with other dicot families. Expression analysis of these Pht1 members revealed that except LePT8, of which the transcript was undetectable in all tissues, the other seven paralogues showed differential but partial-overlapping expression patterns. LePT1 and LePT7 were ubiquitously expressed in all tissues examined, and their transcripts were induced abundantly in response to Pi starvation; LePT2 and LePT6, the two paralogues harboring identical coding sequence, were predominantly expressed in Pi-deficient roots; LePT3, LePT4 and LePT5 were strongly activated in the roots colonized by arbuscular mycorrhizal fungi under low-P, but not high-P condition. Histochemical analysis revealed that a 1250-bp LePT3 promoter fragment and a 471-bp LePT5 promoter fragment containing the two elements, MYCS and P1BS, were sufficient to direct the GUS reporter expression in mycorrhizal roots and were limited to distinct cells harboring AM fungal structures. Additionally, the four paralogues, LePT1, LePT2, LePT6 and LePT7, were very significantly down-regulated in the mycorrhizal roots under low Pi supply condition.
Conclusions: The results obtained from this study provide new insights into the evolutionary expansion, functional divergence and genetic redundancy of the Pht1 genes in response to Pi deficiency and mycorrhizal symbiosis in tomato.
Figures


Similar articles
-
The characterization of novel mycorrhiza-specific phosphate transporters from Lycopersicon esculentum and Solanum tuberosum uncovers functional redundancy in symbiotic phosphate transport in solanaceous species.Plant J. 2005 Apr;42(2):236-50. doi: 10.1111/j.1365-313X.2005.02364.x. Plant J. 2005. PMID: 15807785
-
Functional characterization of LePT4: a phosphate transporter in tomato with mycorrhiza-enhanced expression.J Exp Bot. 2007;58(10):2491-501. doi: 10.1093/jxb/erm096. Epub 2007 Jun 1. J Exp Bot. 2007. PMID: 17545228
-
Integrative Analysis of the Wheat PHT1 Gene Family Reveals A Novel Member Involved in Arbuscular Mycorrhizal Phosphate Transport and Immunity.Cells. 2019 May 22;8(5):490. doi: 10.3390/cells8050490. Cells. 2019. PMID: 31121904 Free PMC article.
-
Physiological and molecular evidence for Pi uptake via the symbiotic pathway in a reduced mycorrhizal colonization mutant in tomato associated with a compatible fungus.New Phytol. 2005 Nov;168(2):445-54. doi: 10.1111/j.1469-8137.2005.01523.x. New Phytol. 2005. PMID: 16219083
-
The characterization of six auxin-induced tomato GH3 genes uncovers a member, SlGH3.4, strongly responsive to arbuscular mycorrhizal symbiosis.Plant Cell Physiol. 2015 Apr;56(4):674-87. doi: 10.1093/pcp/pcu212. Epub 2014 Dec 21. Plant Cell Physiol. 2015. PMID: 25535196
Cited by
-
SlDELLA interacts with SlPIF4 to regulate arbuscular mycorrhizal symbiosis and phosphate uptake in tomato.Hortic Res. 2024 Jul 21;11(9):uhae195. doi: 10.1093/hr/uhae195. eCollection 2024 Sep. Hortic Res. 2024. PMID: 39257536 Free PMC article.
-
Genome-Wide Identification and Expression Profile Analysis of the PHT1 Gene Family in Gossypium hirsutum and Its Two Close Relatives of Subgenome Donor Species.Int J Mol Sci. 2020 Jul 11;21(14):4905. doi: 10.3390/ijms21144905. Int J Mol Sci. 2020. PMID: 32664546 Free PMC article.
-
Characterization and stress-responsive regulation of CmPHT1 genes involved in phosphate uptake and transport in Melon (Cucumis melo L.).BMC Plant Biol. 2024 Jul 23;24(1):696. doi: 10.1186/s12870-024-05405-w. BMC Plant Biol. 2024. PMID: 39044142 Free PMC article.
-
Interactions Between Phosphorus, Zinc, and Iron Homeostasis in Nonmycorrhizal and Mycorrhizal Plants.Front Plant Sci. 2019 Sep 26;10:1172. doi: 10.3389/fpls.2019.01172. eCollection 2019. Front Plant Sci. 2019. PMID: 31616454 Free PMC article. Review.
-
Identification of an ATP-Binding Cassette Transporter Implicated in Aluminum Tolerance in Wild Soybean (Glycine soja).Int J Mol Sci. 2021 Dec 9;22(24):13264. doi: 10.3390/ijms222413264. Int J Mol Sci. 2021. PMID: 34948067 Free PMC article.
References
-
- Mengel K, Kirkby EA. Principles of plant nutrition. Dordrecht, the Netherlands: Kluwer Academic Publishers; 2001.
-
- Smith SE, Jakobsen I, Grønlund M, Smith FA. Roles of arbuscular mycorrhizas in plant phosphorus nutrition: interactions between pathways of phosphorus uptake in arbuscular mycorrhizal roots have important implications for understanding and manipulating plant phosphorus acquisition. Plant Physiol. 2011;156:1050–1057. doi: 10.1104/pp.111.174581. - DOI - PMC - PubMed
Publication types
MeSH terms
Substances
LinkOut - more resources
Full Text Sources
Other Literature Sources
Research Materials
Miscellaneous
