. 2014 Mar 11;5(2):e01033-13.
doi: 10.1128/mBio.01033-13.

Pervasive transcription of a herpesvirus genome generates functionally important RNAs

Affiliations

Pervasive transcription of a herpesvirus genome generates functionally important RNAs

Susan P Canny et al. mBio. .

Abstract

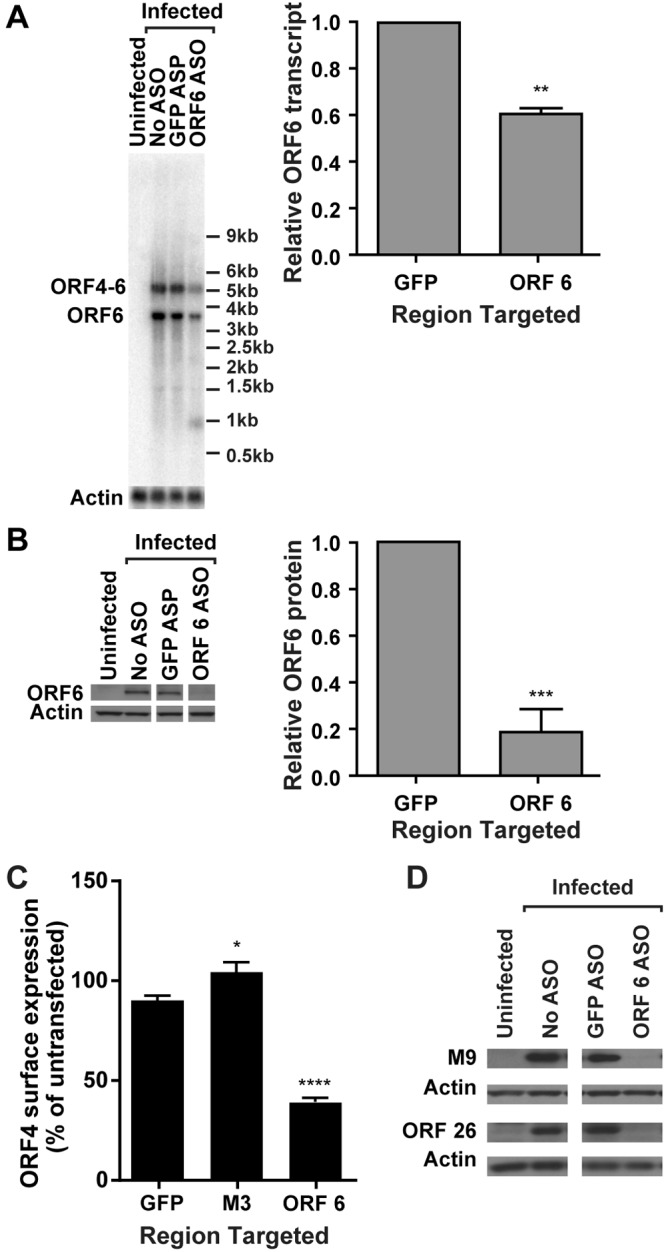
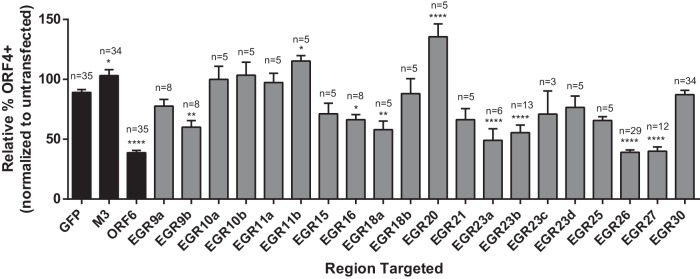
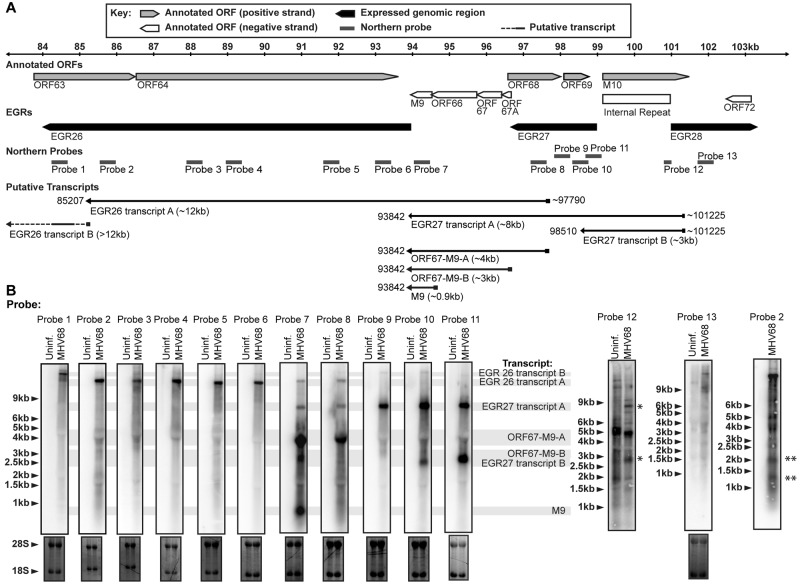
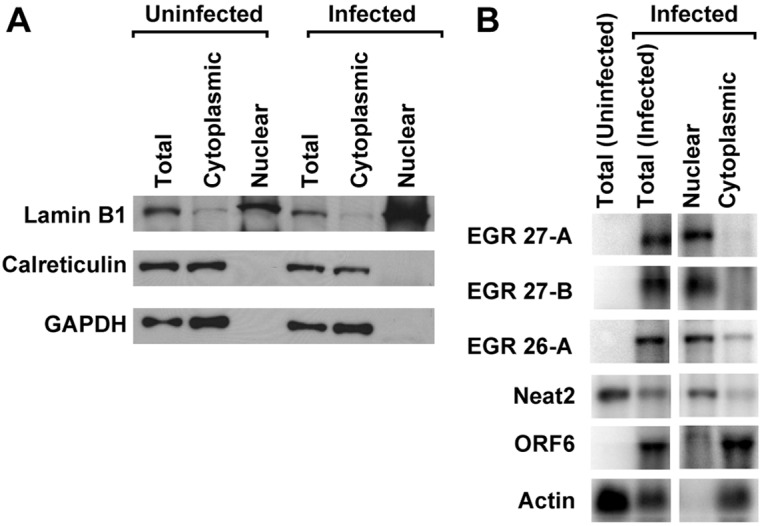
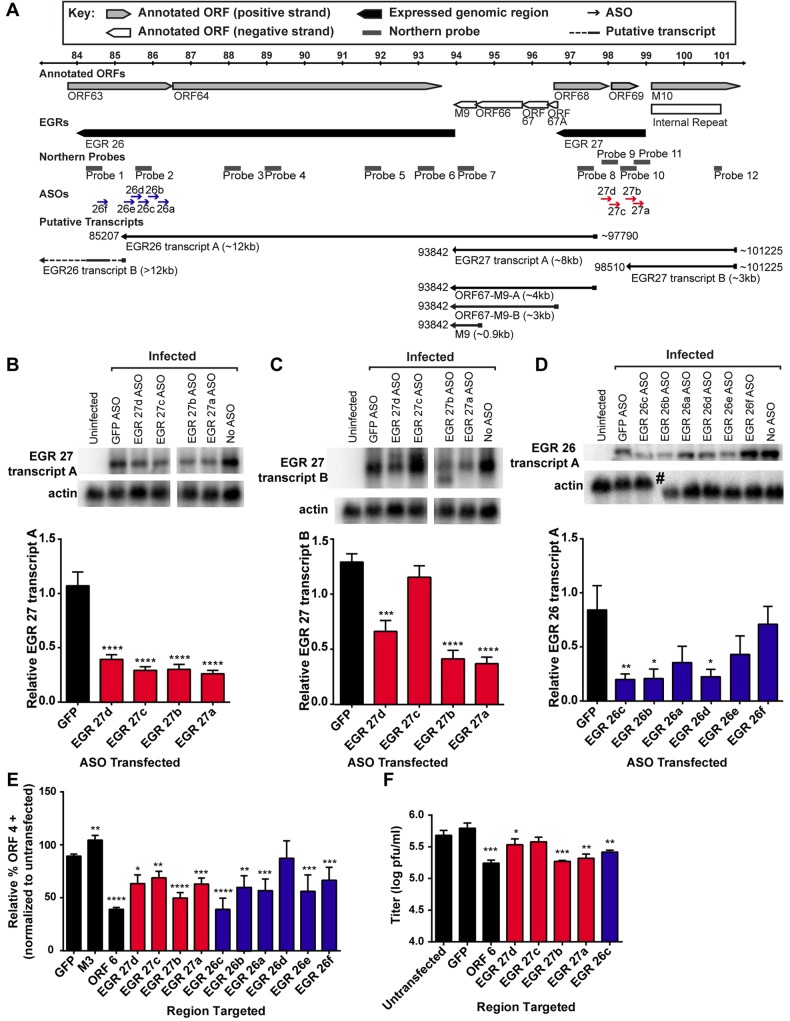
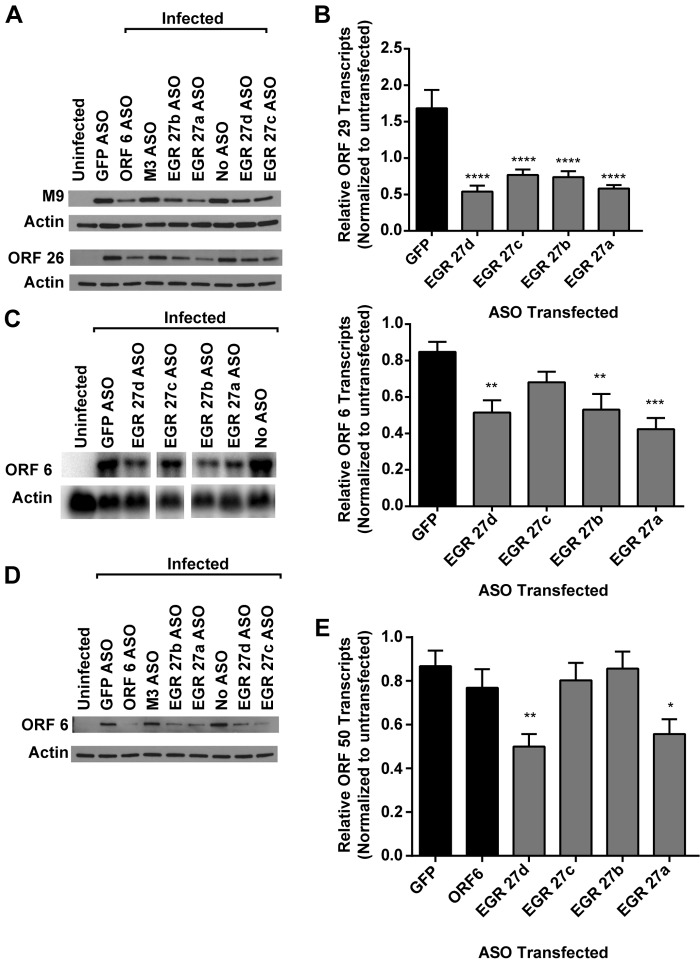
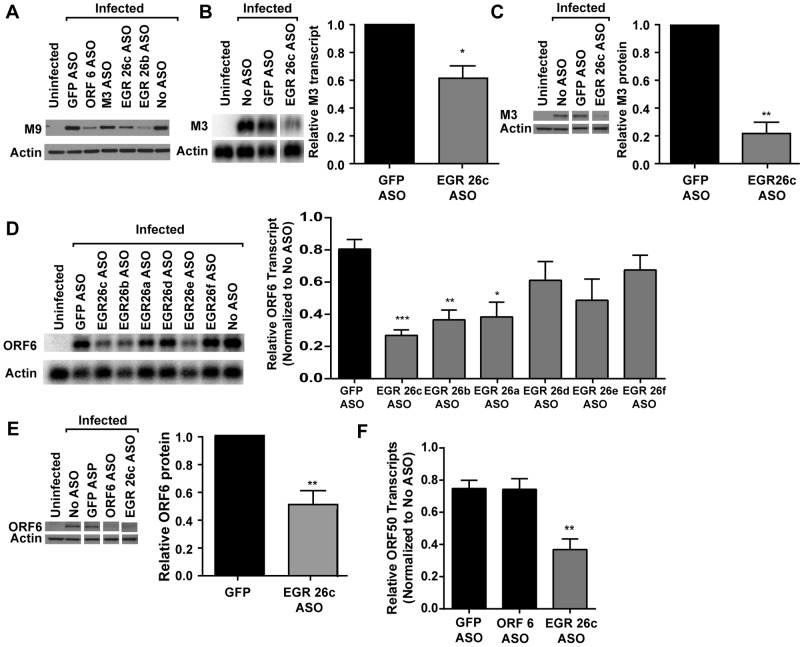
Pervasive transcription is observed in a wide range of organisms, including humans, mice, and viruses, but the functional significance of the resulting transcripts remains uncertain. Current genetic approaches are often limited by their emphasis on protein-coding open reading frames (ORFs). We previously identified extensive pervasive transcription from the murine gammaherpesvirus 68 (MHV68) genome outside known ORFs and antisense to known genes (termed expressed genomic regions [EGRs]). Similar antisense transcripts have been identified in many other herpesviruses, including Kaposi's sarcoma-associated herpesvirus and human and murine cytomegalovirus. Despite their prevalence, whether these RNAs have any functional importance in the viral life cycle is unknown, and one interpretation is that these are merely "noise" generated by functionally unimportant transcriptional events. To determine whether pervasive transcription of a herpesvirus genome generates RNA molecules that are functionally important, we used a strand-specific functional approach to target transcripts from thirteen EGRs in MHV68. We found that targeting transcripts from six EGRs reduced viral protein expression, proving that pervasive transcription can generate functionally important RNAs. We characterized transcripts emanating from EGRs 26 and 27 in detail using several methods, including RNA sequencing, and identified several novel polyadenylated transcripts that were enriched in the nuclei of infected cells. These data provide the first evidence of the functional importance of regions of pervasive transcription emanating from MHV68 EGRs. Therefore, studies utilizing mutation of a herpesvirus genome must account for possible effects on RNAs generated by pervasive transcription. IMPORTANCE The fact that pervasive transcription produces functionally important RNAs has profound implications for design and interpretation of genetic studies in herpesviruses, since such studies often involve mutating both strands of the genome. This is a common potential problem; for example, a conservative estimate is that there are an additional 73,000 nucleotides transcribed antisense to annotated ORFs from the 119,450-bp MHV68 genome. Recognizing the importance of considering the function of each strand of the viral genome independently, we used strand-specific approaches to identify six regions of the genome encoding transcripts that promoted viral protein expression. For two of these regions, we mapped novel transcripts and determined that targeting transcripts from these regions reduced viral replication and the expression of other viral genes. This is the first description of a function for these RNAs and suggests that novel transcripts emanating from regions of pervasive transcription are critical for the viral life cycle.


Figures

FIG 1
FIG 1
An antisense oligonucleotide to ORF 6 decreases ORF 6 transcript and protein expression and late-gene expression. 3T12 cells transfected with ASOs targeting ORF 6, M3, or GFP (negative control) or left untransfected (No ASO) were infected with MHV68. (A) Representative Northern blot for ORF 6 or actin transcripts at 14 hpi and corresponding quantification of ORF 6 monocistronic transcript levels normalized to those of actin (MOI = 10; values are means and standard errors of the means [SEMs] from 3 experiments; **, P < 0.01 by paired t test). (B) Representative Western blot for ORF 6 and actin protein at 18 hpi and corresponding quantification of ORF 6 normalized to actin (MOI = 10; data are means and SEMs from 8 experiments; ***, P < 0.001 by paired t test). Relevant lanes of representative blots are shown. (C) Flow cytometry analysis of ORF 4 surface expression at 24 hpi (MOI = 5 or 10). Flow cytometry data are graphed as the percentage of ORF 4-positive cells for each condition normalized to the value from untransfected cells (data are means and SEMs for 34 to 35 replicates; statistically significant results relative to GFP are indicated; ****, P < 0.0001 by one-way ANOVA with Dunnett’s posttest). (D) Western blot analysis of M9 or ORF 26 at 18 hpi. Relevant lanes of representative blots are shown. Data are representative of four independent experiments.
FIG 2
FIG 2
Targeting of EGRs 9, 16, 18, 23, 26, and 27 reduces ORF4 surface expression on infected cells. 3T12 cells transfected with the indicated ASOs or left untransfected were analyzed for cell surface expression of ORF 4 at 24 hpi by flow cytometry. Cells were infected at an MOI of 5 or 10. Controls were included in parallel in each experiment in which EGRs were analyzed. The percentage of ORF 4-positive cells for each condition was normalized to the value from untransfected cells. Data are means of the pooled data and SEMs; n, number of independent experiments. Statistically significant results relative to GFP are shown. *, P < 0.05; **, P < 0.01; ***, P < 0.001; ****, P < 0.0001 (one-way ANOVA with Dunnett’s posttest). Black bars, controls (data reproduced from Fig. 1C); gray bars, EGRs.
FIG 3
FIG 3
EGR 26 and 27 transcriptional architecture. (A) Schematic representation of EGR 26-27/M9 region transcripts. Approximate size and transcript name are listed below the relevant transcript. (B) Northern blot detection of EGR 26-27/M9 region transcripts. RNA harvested at 18 hpi (MOI = 10) was analyzed by Northern blot analysis using the indicated probes. 28S and 18S rRNA bands visualized by ethidium bromide staining to demonstrate equal loading are shown below the corresponding Northern blots. Northern blots analyzed with probe 12 and probe 2 (far right) had 500 ng of poly(A)-selected RNA per lane. *, virus-specific bands that are of comparable size to EGR 27 transcripts A and B. **, smaller EGR 26 transcripts referenced in text.
FIG 4
FIG 4
EGR 26 and 27 transcripts are enriched in nucleus of infected cells. Protein or RNA extracted from nuclear or cytoplasmic fractions or unfractionated cells (Total) was analyzed by Western blotting (A) or Northern blotting (B) at 18 hpi (MOI = 10). (A) Four micrograms of protein was loaded per sample. (B) Five micrograms of RNA for each total sample and approximate cellular equivalents for nuclear (0.5 µg) or cytoplasmic (4.5 µg) fractions were analyzed. Data are representative of three independent experiments. EGR 26-A indicates EGR 26 transcript A (as shown in Fig. 3) detected using Northern blot probe 2. EGR 27-A and 27-B indicate EGR 27 transcripts A and B, respectively (as shown in Fig. 3) detected using Northern blot probe 11.
FIG 5
FIG 5
Effect of targeting EGR 26 and EGR 27 transcripts on ORF 4 surface expression and viral replication. (A) Schematic of EGR 26s and 27. See Table S1 in the supplemental material for specific coordinates targeted by ASOs. (B to D) 3T12 cells transfected with the indicated ASOs were analyzed for EGR 27 transcript A (B), EGR 27 transcript B (C), or EGR 26 transcript A (D) at 14 hpi by Northern blotting. EGR 27 transcripts A and B were detected using Northern blot probe 11, and EGR 26 transcript A was detected using Northern blot probe 2. Depending on the experiment, 1.5 to 5 µg RNA was used per sample. The graphs are quantitations of signal intensity of the indicated transcript normalized to actin and presented as a fraction of the signal from untransfected cells. Representative Northern blots are shown. The actin for EGR 27 transcripts is reproduced for panels B and C, as the same blot is displayed. The pound sign indicates the location of a tear in the agarose gel. Data are the means of the pooled data (3 to 7 experiments) and SEMs. (E) 3T12 cells transfected with the indicated ASOs were analyzed for cell surface expression of ORF4 at 24 hpi by flow cytometry. As for Fig. 2, the percentage of ORF4-positive cells for each condition was normalized to the value from untransfected cells. Data are means of the pooled data (5 to 35 experiments) and SEMs. (F) 3T12 cells transfected with the indicated ASOs were analyzed for viral titer at 24 hpi by plaque assay. Data are means (3 experiments) and SEMs. Statistically significant results relative to GFP are shown (*, P < 0.05; **, P < 0.01; ***, P < 0.001; ****, P < 0.0001; one-way ANOVA with Dunnett’s posttest). Black bars, controls; blue bars, EGR 26 ASOs; red bars, EGR 27 ASOs.
FIG 6
FIG 6
Effect on immediate-early, early, and late genes by EGR 27. 3T12 cells transfected with GFP or ASOs targeting EGR 27 or left untransfected (No ASO) were infected with MHV68 (MOI = 10) and analyzed for protein (A and D) or transcript levels (B, C, and E). See Fig. 5 and also Table S1 in the supplemental material for ASO locations. (A) Representative Western blots for M9 and ORF 26 proteins at 18 hpi (2 or 3 experiments). (B) ORF 29 transcript levels at 14 hpi. RNA (1 µg) was reverse transcribed (RT), and cDNA was analyzed by qPCR using primers designed to detect spliced ORF 29 transcripts or GAPDH. Data are relative ORF 29 abundance normalized to GAPDH transcript abundance and compared to untransfected cells by the ∆∆CT method (means and SEMs from 3 to 8 experiments). (C) Representative Northern blot for ORF 6 and actin at 14 hpi and corresponding quantification of ORF 6 transcript levels normalized to actin and compared to the value for untransfected cells (means and SEMs from 5 to 7 experiments). (D) Representative Western blot for ORF 6 and actin at 18 hpi (3 experiments). The representative experiment is the one whose results are shown in panel A. (E) ORF 50 transcript levels at 14 hpi measured by qRT-PCR, as for panel B. Statistical analyses were performed by one-way ANOVA with Dunnett’s posttest. *, P < 0.05; **, P < 0.01; ***, P < 0.001; ****, P < 0.0001.
FIG 7
FIG 7
EGR 26c ASO decreases specific genes of all kinetic classes. 3T12 cells transfected with GFP or EGR 26c ASO or untransfected (No ASO) were infected with MHV68 (MOI = 10) and analyzed for protein (A, C, and E) or transcript levels (B, D, and F). (A) Representative Western blots for M9 and actin at 18 hpi (2 experiments). (B) Representative Northern blot using a probe to M3 or actin at 14 hpi and corresponding quantification of M3 transcript levels normalized to those of actin (means and SEMs from 3 experiments). A 0.5-µg portion of RNA was used per lane for M3 Northern blots. (C) Representative Western blot for M3 protein at 18 hpi and corresponding quantification of M3 protein levels normalized to those of actin (means and SEMs from 4 experiments). (D) Representative Northern blot for ORF 6 and actin at 14 hpi and corresponding quantification of ORF 6 transcript levels normalized to actin for cells transfected with GFP or EGR 26 ASOs (means and SEMs from 3 to 5 experiments). (E) Representative Western blot for ORF 6 and actin at 18 hpi and corresponding quantification of ORF 6 protein normalized to actin (means and SEMs from 5 experiments). Representative Western blots for ORF 6 are the same as in Fig. 1. (F) ORF 50 transcript levels at 14 hpi. RNA (1 µg) was reverse transcribed, and cDNA was analyzed by qPCR using primers designed to detect spliced ORF 50 transcripts or GAPDH. Data are relative ORF 50 abundances normalized to GAPDH transcript abundance and compared to untransfected cells by the ∆∆CT method (means and SEMs from 4 experiments). Statistical analyses were performed by paired t test (A, B, C, and E) or one-way ANOVA with Dunnett’s posttest (D and F). *, P < 0.05; **, P < 0.01; ***, P < 0.001.

References

    1. Virgin HW, Latreille P, Wamsley P, Hallsworth K, Weck KE, Dal Canto AJ, Speck SH. 1997. Complete sequence and genomic analysis of murine gammaherpesvirus 68. J. Virol. 71:5894–5904 - PMC - PubMed
    1. Efstathiou S, Ho YM, Hall S, Styles CJ, Scott SD, Gompels UA. 1990. Murine herpesvirus 68 is genetically related to the gammaherpesviruses Epstein-Barr virus and herpesvirus Saimiri. J. Gen. Virol. 71:1365–1372. 10.1099/0022-1317-71-6-1365 - DOI - PubMed
    1. Lee KS, Groshong SD, Cool CD, Kleinschmidt-DeMasters BK, van Dyk LF. 2009. Murine gammaherpesvirus 68 infection of IFNgamma unresponsive mice: a small animal model for gammaherpesvirus-associated B-cell lymphoproliferative disease. Cancer Res. 69:5481–5489. 10.1158/0008-5472.CAN-09-0291 - DOI - PMC - PubMed
    1. Sunil-Chandra NP, Arno J, Fazakerley J, Nash AA. 1994. Lymphoproliferative disease in mice infected with murine gammaherpesvirus 68. Am. J. Pathol. 145:818–826 - PMC - PubMed
    1. Tarakanova VL, Suarez F, Tibbetts SA, Jacoby MA, Weck KE, Hess JL, Speck SH, Virgin HW. 2005. Murine gammaherpesvirus 68 infection is associated with lymphoproliferative disease and lymphoma in BALB beta2 microglobulin-deficient mice. J. Virol. 79:14668–14679. 10.1128/JVI.79.23.14668-14679.2005 - DOI - PMC - PubMed

Publication types

LinkOut - more resources