. 2014 Mar 25;111(12):4608-13.
doi: 10.1073/pnas.1320223111. Epub 2014 Mar 11.

Water diffusion reveals networks that modulate multiregional morphological plasticity after repetitive brain stimulation

Affiliations

Water diffusion reveals networks that modulate multiregional morphological plasticity after repetitive brain stimulation

Mitsunari Abe et al. Proc Natl Acad Sci U S A. .

Abstract

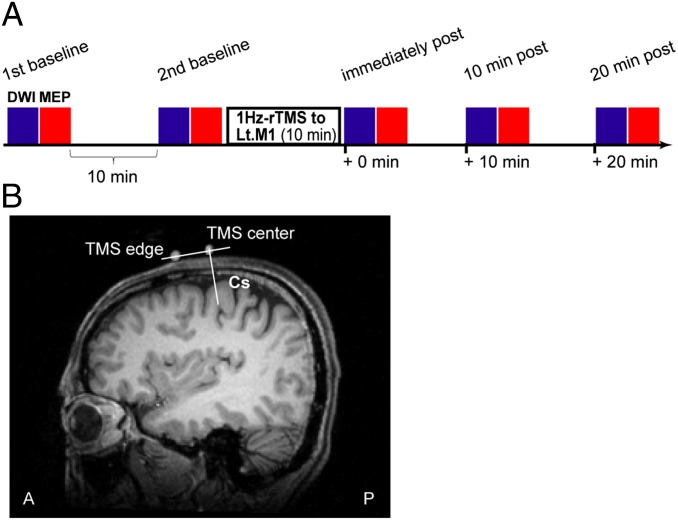
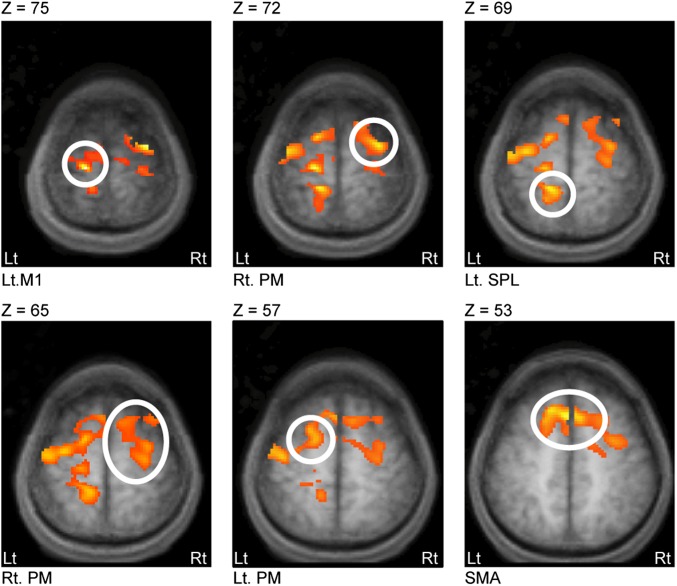
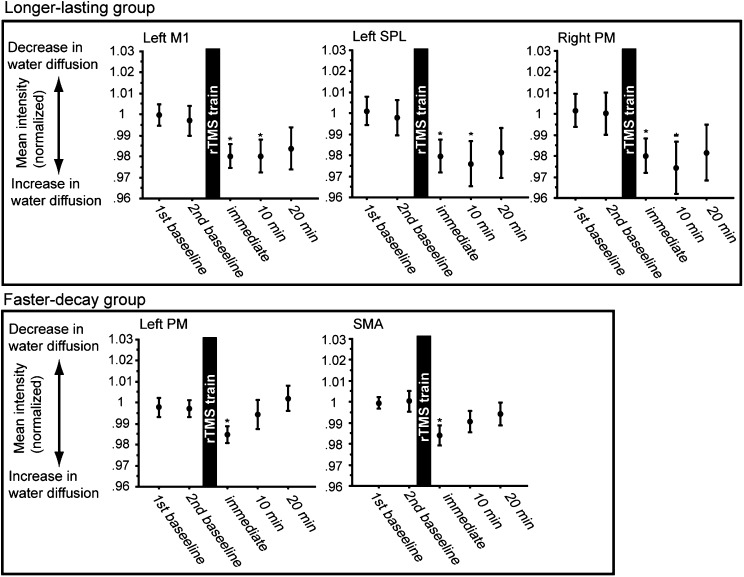
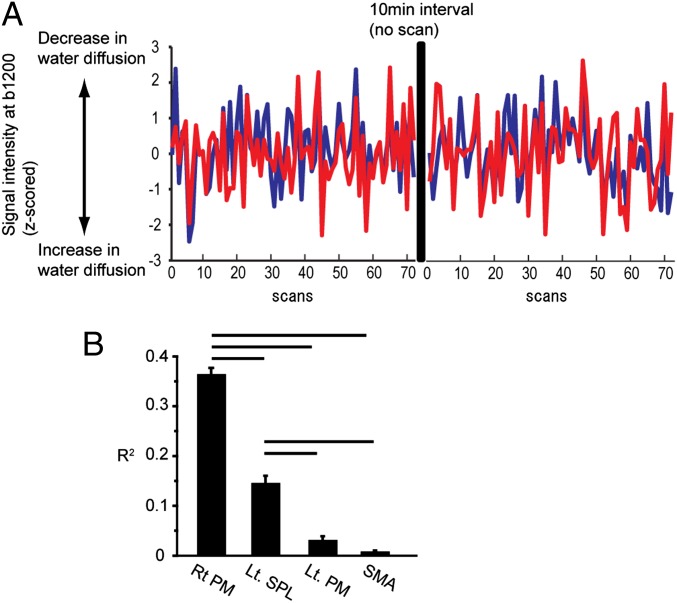
Repetitive brain stimulation protocols induce plasticity in the stimulated site in brain slice models. Recent evidence from network models has indicated that additional plasticity-related changes occur in nonstimulated remote regions. Despite increasing use of brain stimulation protocols in experimental and clinical settings, the neural substrates underlying the additional effects in remote regions are unknown. Diffusion-weighted MRI (DWI) probes water diffusion and can be used to estimate morphological changes in cortical tissue that occur with the induction of plasticity. Using DWI techniques, we estimated morphological changes induced by application of repetitive transcranial magnetic stimulation (rTMS) over the left primary motor cortex (M1). We found that rTMS altered water diffusion in multiple regions including the left M1. Notably, the change in water diffusion was retained longest in the left M1 and remote regions that had a correlation of baseline fluctuations in water diffusion before rTMS. We conclude that synchronization of water diffusion at rest between stimulated and remote regions ensures retention of rTMS-induced changes in water diffusion in remote regions. Synchronized fluctuations in the morphology of cortical microstructures between stimulated and remote regions might identify networks that allow retention of plasticity-related morphological changes in multiple regions after brain stimulation protocols. These results increase our understanding of the effects of brain stimulation-induced plasticity on multiregional brain networks. DWI techniques could provide a tool to evaluate treatment effects of brain stimulation protocols in patients with brain disorders.


Conflict of interest statement

The authors declare no conflict of interest.

Figures

Fig. 1.
Fig. 1.
Experimental procedures. (A) Experimental design. Subthreshold, 1-Hz rTMS was applied to the hand area of the left primary motor cortex for 10 min. The stimulation intensity was 90% of resting motor threshold and was not strong enough to induce contractions in the muscles of the right hand. DWI (blue bars) was performed with high (1,200 s/mm2, n = 72 scans at each time point) and low (300 s/mm2, n = 18 scans at each time point) b values, and MEPs (red bars, n = 20 at each time point) were measured at two baseline time points, and immediately, 10 min, and 20 min after rTMS. The two baseline measurements were separated by 10 min. Throughout the entire experiment, the subjects were inside an MRI scanner and were instructed to keep still with their eyes open. (B) The position of the TMS coil relative to the central sulcus (CS) in one subject (T.A.). White dots indicate the positions of the center (TMS center) and edge (TMS edge) of the figure-eight-shaped coil. The line perpendicular to the line crossing these two dots passes through the hand area of the left primary motor cortex and indicates the optimal position of the coil for maximally stimulating this region.
Fig. 2.
Fig. 2.
The left M1 and remote regions of the brain showed a significant increase in water diffusion immediately after the end of rTMS. Images were acquired with an axial field of view covering the hand area of the left M1 and other motor-related regions that were affected by 1-Hz rTMS over the hand area of the left M1 (7, 8). Data acquired with a b value of 1200 s/mm2 were used to estimate change in water diffusion (14, 16). Mean signal intensity was calculated for each voxel at each time point as the average of the 72 scans acquired with a b value of 1,200 s/mm2 and was compared voxel-by-voxel between the baseline and the immediately post rTMS time points within subjects. The threshold was set to a cluster size of P < 0.05 corrected with a voxel-level threshold uncorrected P < 0.005. Results are overlaid on axial slices (Z = 75–53) of the averaged anatomical MRI brain. There was a decrease in mean signal intensity, indicating an increase in water diffusion, at the stimulated site (left M1), left SPL, left PM, right PM, and SMA. The coordinate of the peak signal intensity in each of these regions is shown in Table 1. Note that decreased signal intensity indicates increased water diffusion. The same results, i.e., increased water diffusion, were also obtained when the apparent diffusion coefficient was analyzed (Fig. S3). No significant change in water diffusion was observed in any region when data obtained using a lower b value (300 s/mm2) were analyzed (Fig. S2).
Fig. 3.
Fig. 3.
The rTMS-induced change in water diffusion was sustained for a longer period in the left M1, left SPL, and right PM than in the left PM or SMA. The mean normalized signal intensity in each brain region at each time point. The mean intensity was calculated as the mean of the voxels within a 10-mm sphere centered at the coordinate of the peak signal intensity in the region of interest (Table 1) and was normalized for each subject (Methods). The mean signal intensity at the 10- and 20-min after rTMS time points was compared with the baseline and immediately after rTMS time points within each region of interest using statistical parametric maps. The threshold was FWE corrected within the search volume (Methods). Asterisks indicate significant difference (P < 0.05) in the signal intensity compared with the baseline sessions. Bars indicate SEM. Note that decreased signal intensity indicates increased water diffusion and increased signal intensity indicates decreased water diffusion. The mean signal intensity was lower (i.e., water diffusion was higher) immediately after rTMS than at baseline in the left M1 and other regions (Fig. 2 and Table 1). At 10 min after rTMS, the decrease was sustained in the left M1, left SPL, and right PM (Upper) but was not sustained in the left PM or the SMA (Lower). At 20 min after rTMS, water diffusion had returned to baseline values in all regions (no difference even at a liberal threshold of uncorrected P = 0.1). At the 10- and 20-min after time points, no additional regions (i.e., regions additional to those identified at the immediately post time point) showed a significant change in the mean signal intensity.
Fig. 4.
Fig. 4.
Baseline fluctuations in water diffusion in the left M1 were coupled with fluctuations in water diffusion in the right PM and the left SPL more tightly than they were coupled with fluctuations in the left PM or SMA. (A) Water diffusion in the left M1 and right PM in each of the 144 scans from the two baseline time points in a representative subject. Data were transformed to z scores within each measurement time point (Methods). (B) R2 was computed to estimate coherent synchronized fluctuations in water diffusion at baseline between the left M1 and each of the other regions using the time series data (144 data points). Error bars indicate SEM. Correlation was significant when the right PM or left SPL was paired with the left M1 (P < 0.001) but not significant when the left PM (P = 0.15) or SMA (P = 0.60) was paired with the left M1. R2 was largest between the right PM and the left M1 (right PM vs. left SPL, P < 0.001), followed by the left SPL (left SPL vs. left PM, P < 0.001) and then the SMA (left PM vs. SMA, P = 0.007).

References

    1. Filosa A, et al. Neuron-glia communication via EphA4/ephrin-A3 modulates LTP through glial glutamate transport. Nat Neurosci. 2009;12(10):1285–1292. - PMC - PubMed
    1. Pannasch U, et al. Astroglial networks scale synaptic activity and plasticity. Proc Natl Acad Sci USA. 2011;108(20):8467–8472. - PMC - PubMed
    1. Skucas VA, et al. Impairment of select forms of spatial memory and neurotrophin-dependent synaptic plasticity by deletion of glial aquaporin-4. J Neurosci. 2011;31(17):6392–6397. - PMC - PubMed
    1. Li YK, et al. Aquaporin-4 deficiency impairs synaptic plasticity and associative fear memory in the lateral amygdala: Involvement of downregulation of glutamate transporter-1 expression. Neuropsychopharmacology. 2012;37(8):1867–1878. - PMC - PubMed
    1. Hallett M, Chokroverty S (2005) Magnetic Stimulation in Clinical Neurophysiology (Elsevier Butterworth–Heinemann, Philadelphia), 2nd Ed.

Publication types

LinkOut - more resources