

Scaling laws of ambush predator 'waiting' behaviour are tuned to a common ecology
- PMID: 24619440
- PMCID: PMC3973260
- DOI: 10.1098/rspb.2013.2997
Scaling laws of ambush predator 'waiting' behaviour are tuned to a common ecology
Abstract
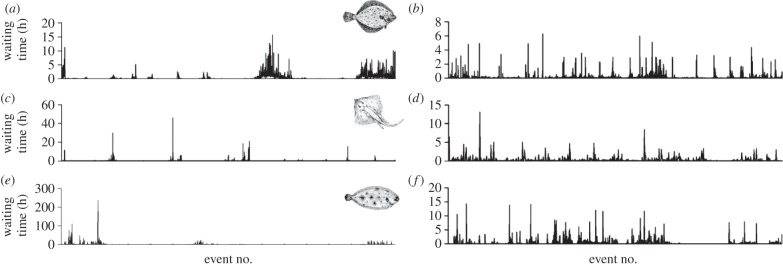
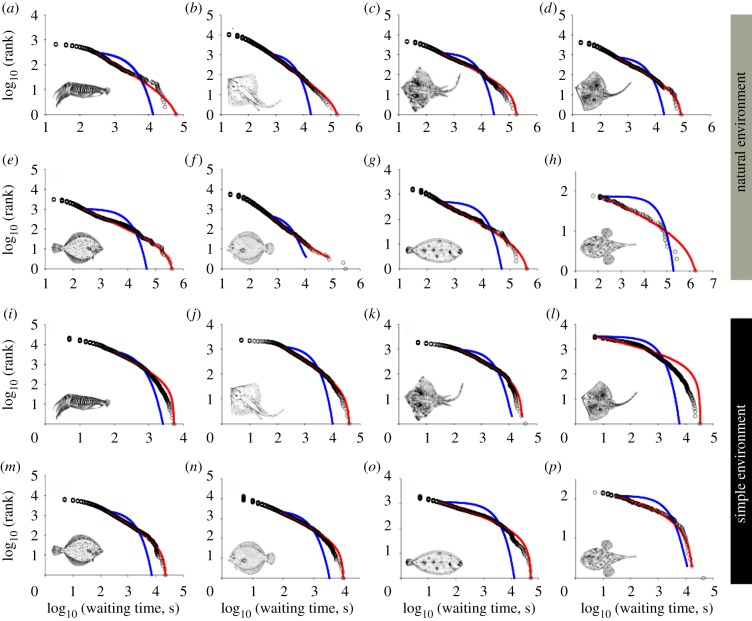
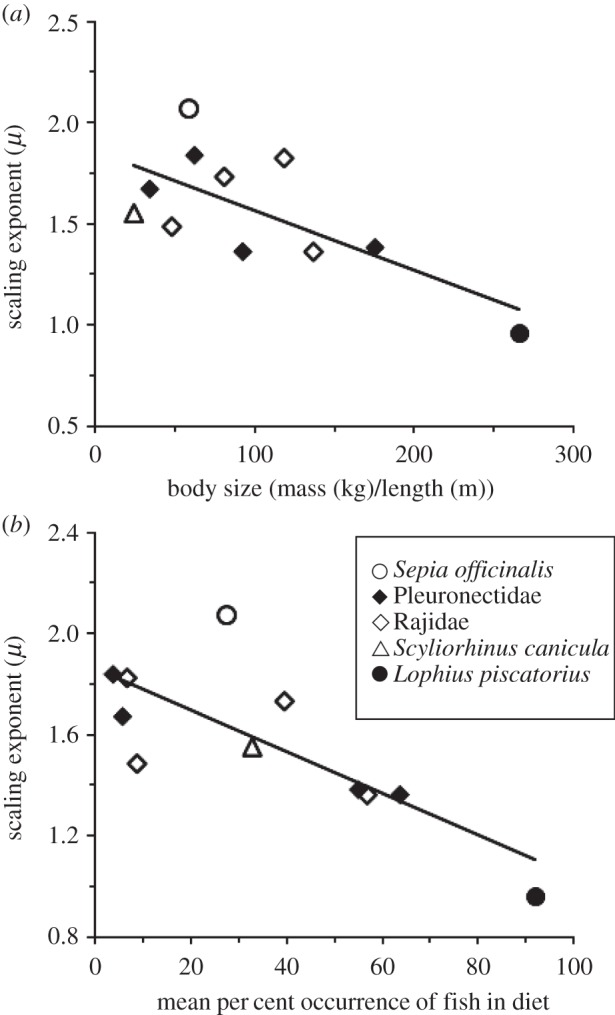
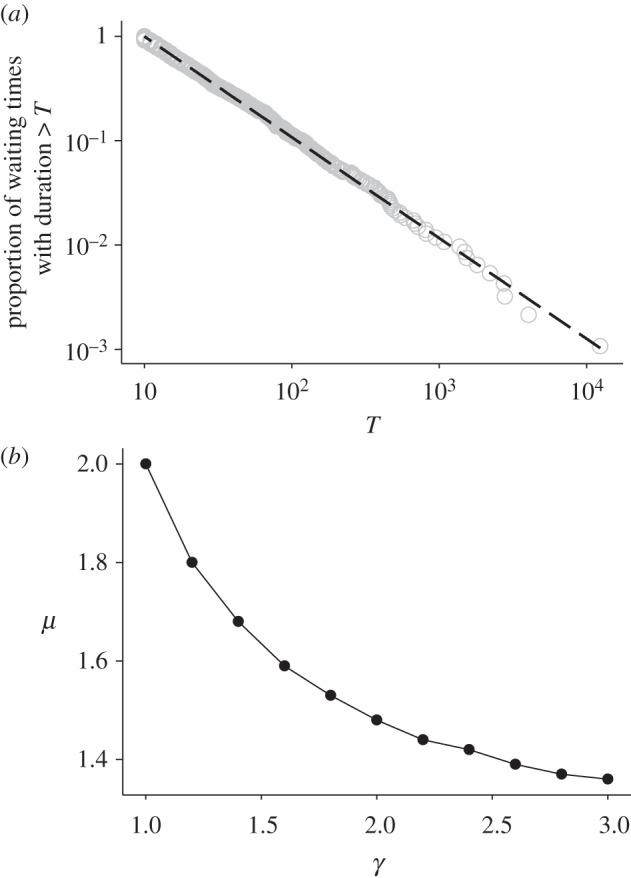
The decisions animals make about how long to wait between activities can determine the success of diverse behaviours such as foraging, group formation or risk avoidance. Remarkably, for diverse animal species, including humans, spontaneous patterns of waiting times show random 'burstiness' that appears scale-invariant across a broad set of scales. However, a general theory linking this phenomenon across the animal kingdom currently lacks an ecological basis. Here, we demonstrate from tracking the activities of 15 sympatric predator species (cephalopods, sharks, skates and teleosts) under natural and controlled conditions that bursty waiting times are an intrinsic spontaneous behaviour well approximated by heavy-tailed (power-law) models over data ranges up to four orders of magnitude. Scaling exponents quantifying ratios of frequent short to rare very long waits are species-specific, being determined by traits such as foraging mode (active versus ambush predation), body size and prey preference. A stochastic-deterministic decision model reproduced the empirical waiting time scaling and species-specific exponents, indicating that apparently complex scaling can emerge from simple decisions. Results indicate temporal power-law scaling is a behavioural 'rule of thumb' that is tuned to species' ecological traits, implying a common pattern may have naturally evolved that optimizes move-wait decisions in less predictable natural environments.
Keywords: foraging strategy; human dynamics; intermittence; movement ecology; random walk; search.
Figures
References
-
- Stephens DW, Krebs JR. 1986. Foraging theory. Princeton, NJ: Princeton University Press
-
- Houston AI, McNamara JM. 1999. Models of adaptive behaviour. Oxford, UK: Oxford University Press
-
- Armstrong JB, Schindler DE. 2011. Excess digestive capacity in predators reflects a life of feast and famine. Nature 476, 84–87 (doi:10.1038/nature10240) - DOI - PubMed
-
- Secor SM, Nagy KA. 1994. Bioenergetic correlates of foraging mode for the snakes Crotalus cerastes and Masticophis flagellum. Ecology 75, 1600–1614 (doi:10.2307/1939621) - DOI
-
- McNamara JM, Houston AI. 2009. Integrating function and mechanism. Trends Ecol. Evol. 24, 670–675 (doi:10.1016/j.tree.2009.05.011) - DOI - PubMed
Publication types
MeSH terms
Grants and funding
LinkOut - more resources
Full Text Sources
Other Literature Sources
