Clinical Trial
. 2014 Apr 29;129(17):1731-41.
doi: 10.1161/CIRCULATIONAHA.113.005841. Epub 2014 Mar 11.

Microstructural impact of ischemia and bone marrow-derived cell therapy revealed with diffusion tensor magnetic resonance imaging tractography of the heart in vivo

Affiliations
Clinical Trial

Microstructural impact of ischemia and bone marrow-derived cell therapy revealed with diffusion tensor magnetic resonance imaging tractography of the heart in vivo

David E Sosnovik et al. Circulation. .

Abstract

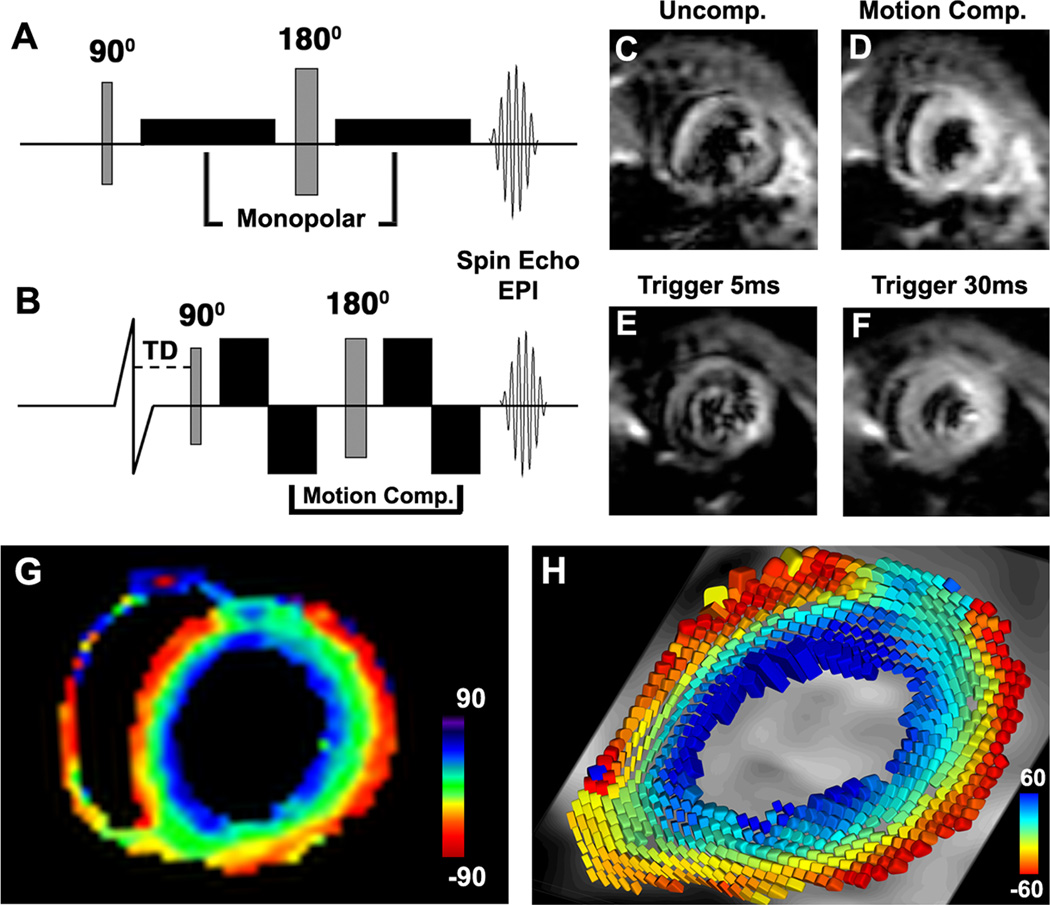
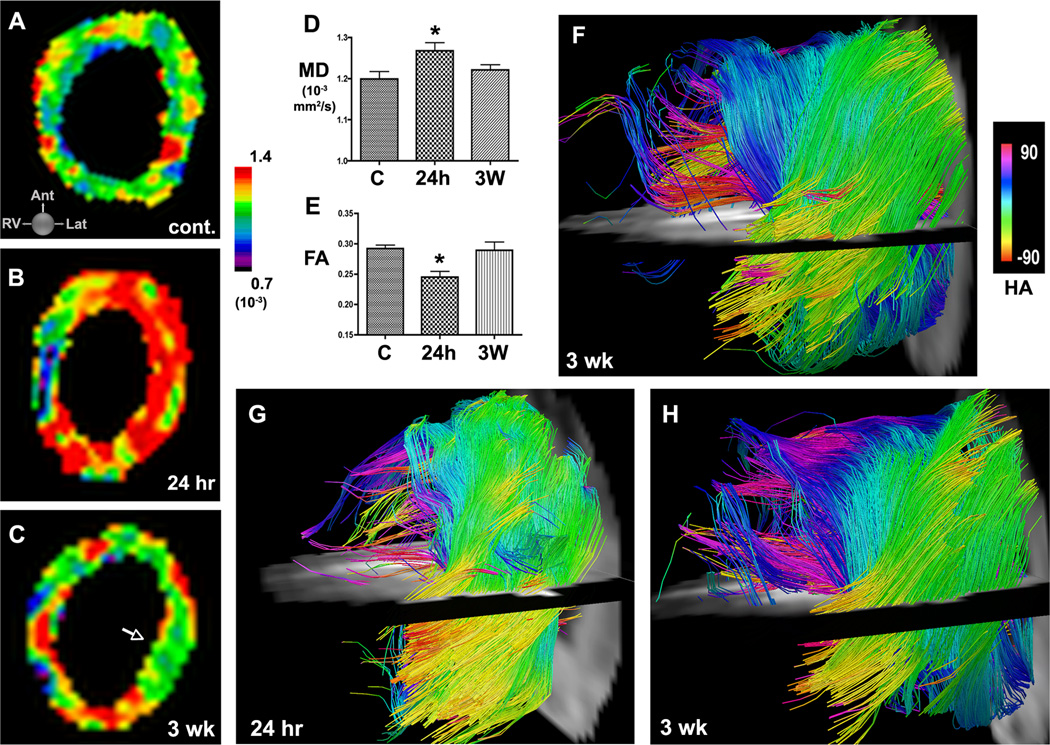
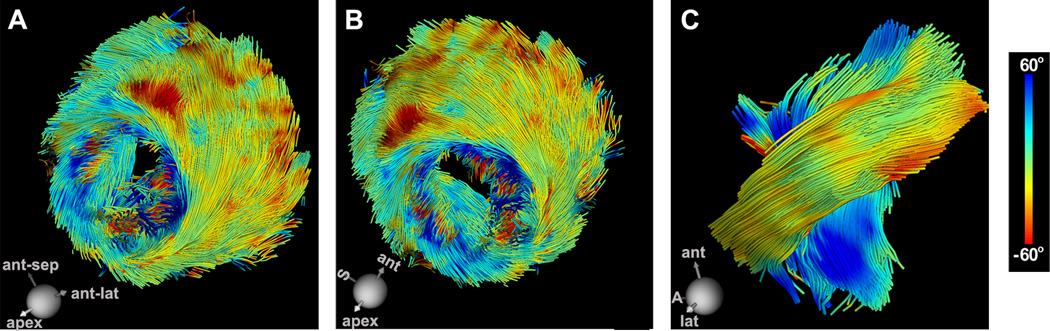
Background: The arrangement of myofibers in the heart is highly complex and must be replicated by injected cells to produce functional myocardium. A novel approach to characterize the microstructural response of the myocardium to ischemia and cell therapy, with the use of serial diffusion tensor magnetic resonance imaging tractography of the heart in vivo, is presented.

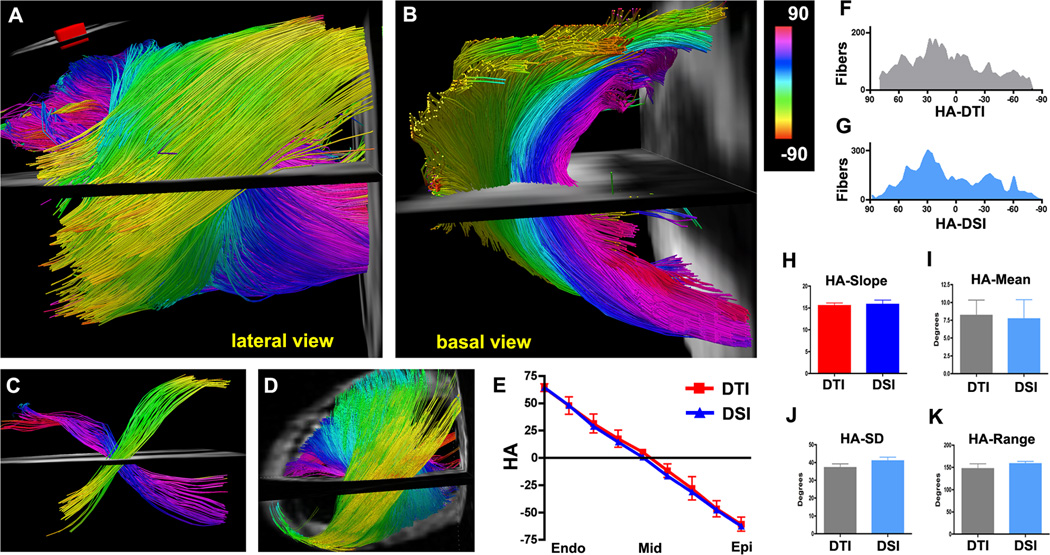
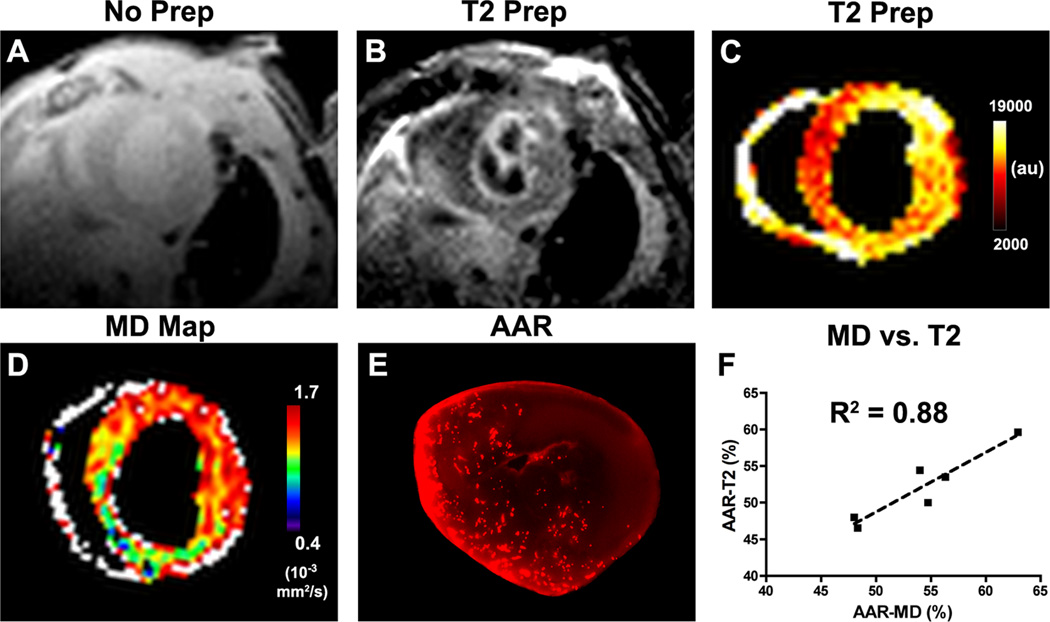
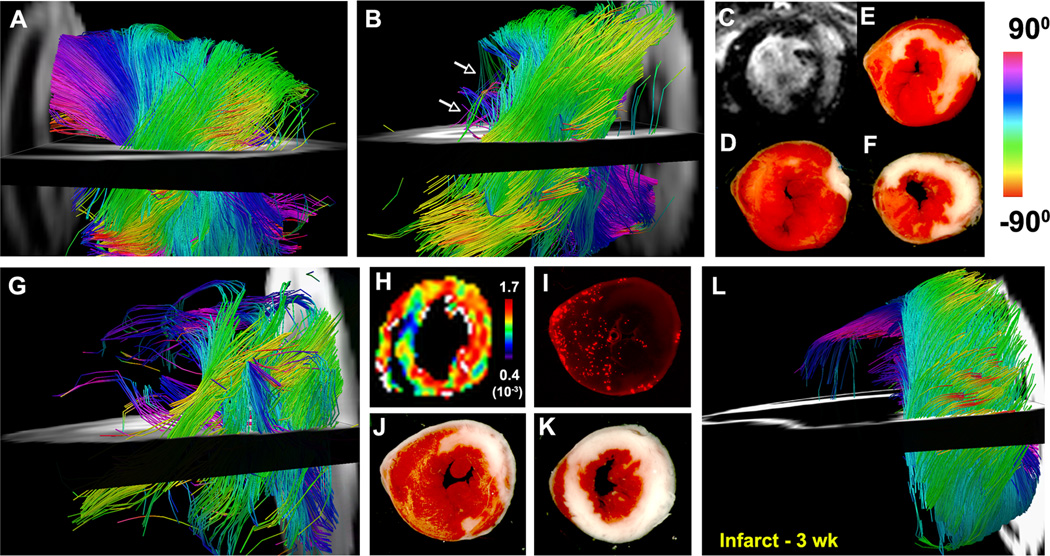
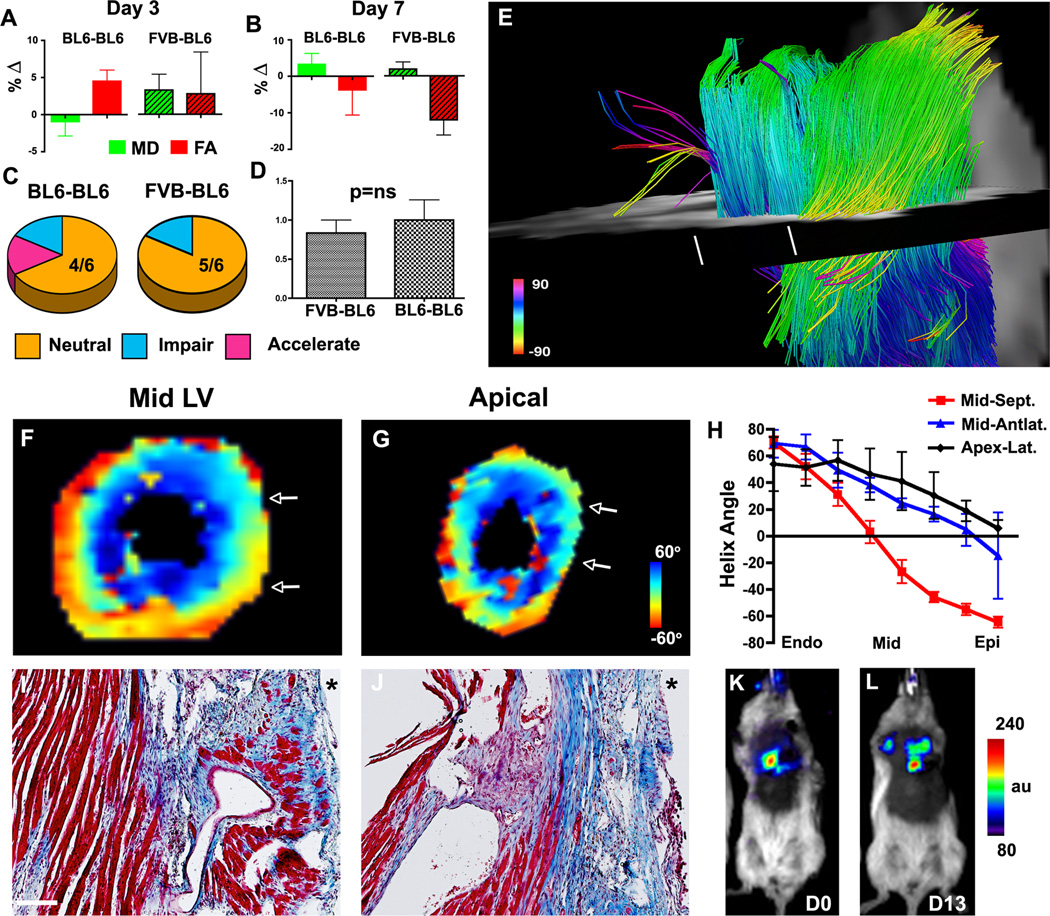
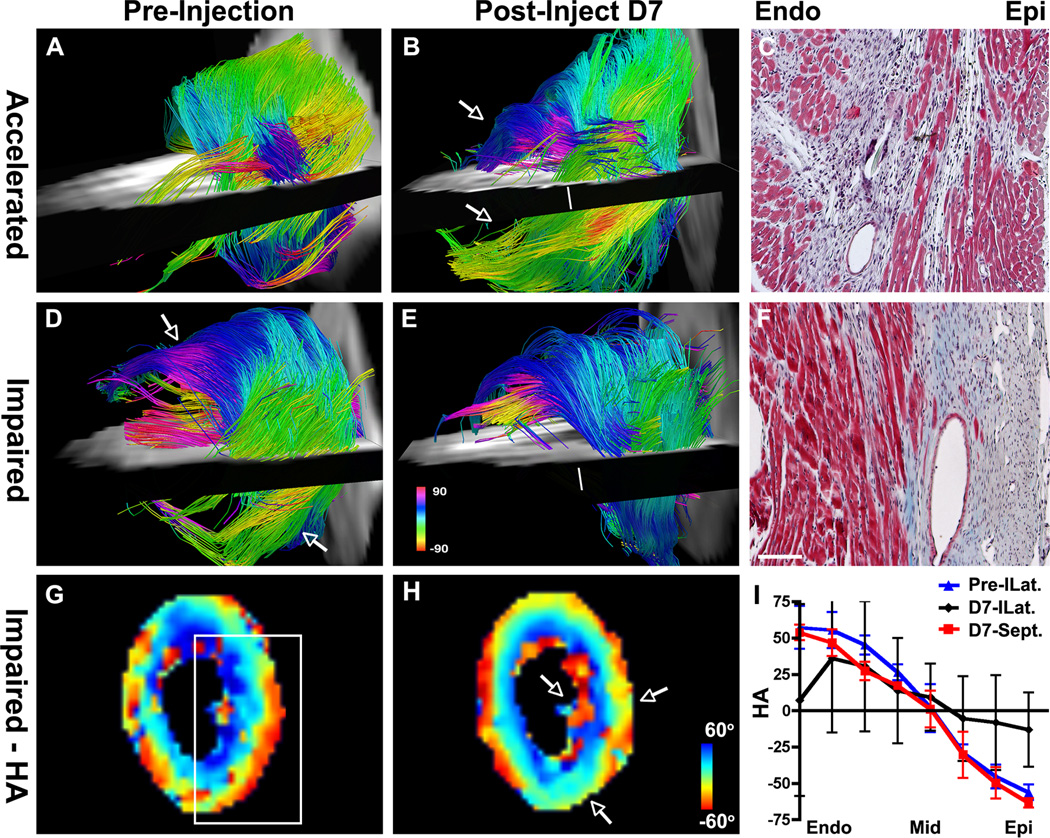
Methods and results: Validation of the approach was performed in normal (n=6) and infarcted mice (n=6) as well as healthy human volunteers. Mice (n=12) were then injected with bone marrow mononuclear cells 3 weeks after coronary ligation. In half of the mice the donor and recipient strains were identical, and in half the strains were different. A positive response to cell injection was defined by a decrease in mean diffusivity, an increase in fractional anisotropy, and the appearance of new myofiber tracts with the correct orientation. A positive response to bone marrow mononuclear cell injection was seen in 1 mouse. The response of the majority of mice to bone marrow mononuclear cell injection was neutral (9/12) or negative (2/12). The in vivo tractography findings were confirmed with histology.

Conclusions: Diffusion tensor magnetic resonance imaging tractography was able to directly resolve the ability of injected cells to generate new myofiber tracts and provided a fundamental readout of their regenerative capacity. A highly novel and translatable approach to assess the efficacy of cell therapy in the heart is thus presented.

Keywords: diffusion tensor imaging; diffusion tractography; ischemia; magnetic resonance imaging; myocardium; stem cell transplantation.


Figures

Figure 1
Figure 1
In vivo DTI of the mouse heart with motion compensated diffusion-encoding gradients. (A) Classic Stejskal-Tanner spin echo sequence with monopolar diffusion-encoding gradients on either side of the 180° refocusing pulse. (B) Motion compensated sequence with velocity-compensated bipolar diffusion-encoding gradients. A trigger delay (TD) is applied to acquire the images in midsystole. (C, D) Diffusion-encoded images of a normal mouse in vivo with (C) the uncompensated sequence and (D) the motion compensated sequence. Severe image degradation is present in the uncompensated sequence, while image quality in the motion compensated sequence is high. (E, F) DTI with the velocity compensated sequence at different phases of the cardiac cycle. Velocity compensation is inadequate at phases of the cardiac cycle with a high proportion of higher order motion coefficients (E) but works robustly in midsystole (F). (G) 2D HA map in a normal mouse in vivo. The expected transmural gradient in HA in the LV is well seen. (H) Diffusion tensor field in the LV, represented by superquadric glyphs and color-coded by HA, demonstrating that the anisotropic nature of the myocardium has been accurately resolved with in vivo DTI.
Figure 2
Figure 2
(A–C) DTI-tractography of a normal mouse heart in vivo. (A, B) Fibers intersecting a ROI (panel A inset) in the lateral wall of the LV are shown and color-coded by HA. (A) Lateral view of fiber architecture in the LV. The characteristic crossing helical pattern of the subendocardial (pink to dark blue) and subepicardial (green-yellow) fibers is well seen. (B) The same heart viewed from the base. The midmyocardial fibers (light blue) are circumferential while the subendocardial and subepicardial fibers are highly oblique. (C) Small ROIs have been placed in the subendocardium and subepicardium of the lateral wall. The crossing helical myofiber pattern in the LV is well resolved with in vivo DTI-tractography. (D) DSI-tractography of a mouse heart ex vivo. (E) Plots of HA vs. transmural depth in normal mice imaged with in vivo DTI (red) and ex vivo DSI. (F, G) Histograms of myofiber HA in the lateral wall obtained with DTI-tractography in vivo (F, gray) and DSI-tractography ex vivo (G, blue). (H–K) No significant differences are seen in the transmural slope, mean, standard deviation (SD) or range of myofiber HA between the DSI and in vivo DTI-tractography datasets.
Figure 3
Figure 3
Measurement of the AAR in mice 24 hours after myocardial infarction. (A) Gradient echo with no T2-preparation applied, (B) same slice with T2-preparation, (C) pseudocolor map of the T2-prepared image. (D) In vivo MD map. (C, D) Both MD and signal intensity in the T2-prepared image are increased in the anterior, lateral and infero-lateral walls of the infarcted mouse. (E) The AAR measured after MRI through the injection of fluorescent microspheres correlates well with the elevation of MD. (F) A strong correlation (R2 = 0.88) was seen between the %AAR by MD and T2-weighted MRI.
Figure 4
Figure 4
(A–K) In vivo DTI-tractography of two mice 24 hours after myocardial infarction. (A) Tractography of fibers in the uninjured septum (viewed from the right ventricle). (B) Lateral view of the LV: A profound loss of fibers (arrows) is seen in the infarcted anterior and lateral walls. (C) LGE and (D–F) TTC staining of the infarct zone, however, show that the subendocardium remains largely viable. (G) Second infarcted mouse also showing a profound loss of tracts in the apical half of the heart. (H–K) In vivo MD map, AAR after fluorescent microsphere injection, and TTC staining of the same mouse heart. No tracts are seen in the infarcted (nonviable) segments of the heart. The subendocardium, which has very few tracts, remains viable but shows a marked elevation in MD (H). The loss of tracts at 24 hours was thus seen in both infarcted myocardium and viable segments with large elevations in MD. (L) Ex vivo DTI-tractography 3 weeks after infarction. The infarct zone is sharply demarcated, thinned, aneurysmal and contains few tracts.
Figure 5
Figure 5
Serial DTI and tractography in mice with IR. (A) In vivo MD map of the LV in a normal control mouse. (B, C) Serial MD maps of the LV in a mouse (B) 24 hours and (C) 3 weeks after IR. MD in the injured anterior and lateral walls rises acutely but by 3 weeks has returned towards baseline (C, arrow). (D, E) Acute injury is characterized by an increase in MD and a decrease in FA at 24 hours. Within 3 weeks of IR, MD and FA have returned back towards their normal values. (F) Tractography of the LV 3 weeks after IR. Moderate disruption of fiber architecture is present but, unlike infarcted mice, resolvable tracts are present in the healed myocardium. (G, H) Serial in vivo DTI-tractography of a mouse (G) 24 hours and (H) 3 weeks after IR. (G) At 24 hours few tracts can be resolved in the apical half of the LV. (H) 3 weeks later MD has returned to baseline and substantially more tracts, particularly in the subendocardium and midmyocardium, can now be resolved. Fiber architecture, however, remains significantly perturbed. C = control, * p < 0.05.
Figure 6
Figure 6
Serial DTI-tractography of mice injected with BMMCs 3 weeks after IR. (A, B) Percent change (∆) in MD and FA from their pre-injection values. On day 3 the BL6-BL6 mice show a positive response (reduced MD, increased FA). However, by day 7 both groups show a deleterious response (increased MD, reduced FA). Green bars = MD, red bars = FA, patterned bars = FVB-BL6. (C) A neutral response to BMMC injection was seen in most mice. (D) No difference in the healing score was seen between the BL6-BL6 and FVB-BL6 groups. (E) DTI-tractography of a mouse in the BL6-BL6 cohort with a neutral response to BMMC injection. A severe loss of fiber tracts persists in the apical half of the LV. The white lines mark the planes of the HA maps (F, G) and histological sections (I, J). The white arrows in the HA maps demarcate the upper/lower edges of the histological sections (10× magnification, scale bar = 100 µm, * = anterolateral epicardium). At the midventricular level (F, I), fiber architecture remains well preserved except in the anterolateral subepicardium. In the more apical plane (G, J) fiber architecture is severely perturbed. (H) Transmural HA plots confirm the progressive loss of myofiber organization from the mid LV to the apex. (K, L) Bioluminescence imaging (identical donor and recipient strains) shows that BMMCs injected into mice 3 weeks after IR survived well.
Figure 7
Figure 7
Serial DTI-tractography in BL6-BL6 mice showing (A–C) an accelerated healing response following BMMC injection and (D–F) an impaired response. (A) Only a few subendocardial and subepicardial tracts are seen in the apical half of the LV pre-injection. (B) Post-injection, coherent tracts (arrows) are seen in both the subepicardium and subendocardium. (C) Masson’s trichrome (short axis plane, 10×) at the level of the white line in panel B confirms the presence of correctly oriented myofibers in the subendocardium and subepicardium. (D) Pre-injection image showing coherent tracts in the subendocardium and subepicardium (arrows). (E) Following BMMC injection fewer tracts are present in the anterolateral subendocardium and tracts in the subepicardium of the inferolateral wall have been completely lost. (F) Masson’s trichrome (10×, short axis section at level of white line in Panel E) confirms the disorganization of fibers in the subendocardium and the complete loss of fibers in the subepicardium. Scale bar = 100 µm. (G–I) HA maps of the heart shown in panels D–F. Before injection HA transitions smoothly from the endocardium to epicardium (white box, G). After injection HA, particularly in the subendocardium and subepicardium (arrows, H), is highly disordered. (I) The transmural evolution of HA in the inferolateral (ILat) wall is relatively normal pre-injection (blue) but severely perturbed at day 7 (D7) post-injection (black). The plot of HA in the septum at D7 (red) is shown for comparison.
Figure 8
Figure 8
In vivo DTI-tractography of the LV in a normal human volunteer. The tracts are color-coded by HA. (A, B) Coherent tracts with the correct orientation can be resolved in all regions of the myocardium. (Dispersion of HA over the papillary muscles and trabeculations of the LV is a normal finding). (C) Magnified view of fibers crossing a ROI in the midlateral wall of the LV. The characteristic crossing pattern of myofibers in the subendocardium and subepicardium can be clearly seen. S = septum, A = apex.

Comment in

References

    1. Rosenzweig A. Medicine. Cardiac regeneration. Science. 2012;338:1549–1550. - PubMed
    1. Streeter DD, Jr, Spotnitz HM, Patel DP, Ross J, Jr, Sonnenblick EH. Fiber orientation in the canine left ventricle during diastole and systole. Circ Res. 1969;24:339–347. - PubMed
    1. Scollan DF, Holmes A, Winslow R, Forder J. Histological validation of myocardial microstructure obtained from diffusion tensor magnetic resonance imaging. Am J Physiol. 1998;275:H2308–H2318. - PubMed
    1. Chen J, Song SK, Liu W, McLean M, Allen JS, Tan J, Wickline SA, Yu X. Remodeling of cardiac fiber structure after infarction in rats quantified with diffusion tensor MRI. Am J Physiol Heart Circ Physiol. 2003;285:H946–H954. - PubMed
    1. Wu EX, Wu Y, Nicholls JM, Wang J, Liao S, Zhu S, Lau CP, Tse HF. MR diffusion tensor imaging study of postinfarct myocardium structural remodeling in a porcine model. Magn Reson Med. 2007;58:687–695. - PubMed

Publication types