The mid-domain effect in ectomycorrhizal fungi: range overlap along an elevation gradient on Mount Fuji, Japan
- PMID: 24621523
- PMCID: PMC4817612
- DOI: 10.1038/ismej.2014.34
The mid-domain effect in ectomycorrhizal fungi: range overlap along an elevation gradient on Mount Fuji, Japan
Abstract
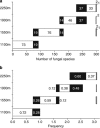
Mid-domain effect (MDE) models predict that the random placement of species' ranges within a bounded geographical area leads to increased range overlap and species richness in the center of the bounded area. These models are frequently applied to study species-richness patterns of macroorganisms, but the MDE in relation to microorganisms is poorly understood. In this study, we examined the characteristics of the MDE in richness patterns of ectomycorrhizal (EM) fungi, an ecologically important group of soil symbionts. We conducted intensive soil sampling to investigate overlap among species ranges and the applicability of the MDE to EM fungi in four temperate forest stands along an elevation gradient on Mount Fuji, Japan. Molecular analyses using direct sequencing revealed 302 EM fungal species. Of 73 EM fungal species found in multiple stands, 72 inhabited a continuous range along the elevation gradient. The maximum overlap in species range and the highest species richness occurred at elevations in the middle of the gradient. The observed richness pattern also fit within the 95% confidence interval of the mid-domain null model, supporting the role of the MDE in EM fungal richness. Deviation in observed richness from the mean of the mid-domain null estimation was negatively correlated with some environmental factors, including precipitation and soil C/N, indicating that unexplained richness patterns could be driven by these environmental factors. Our results clearly support the existence of microbial species' ranges along environmental gradients and the potential applicability of the MDE to better understand microbial diversity patterns.
Figures


References
-
- Aponte C, Garcia LV, Maranon T, Gardes M. (2010). Indirect host effect on ectomycorrhizal fungi: leaf fall and litter quality explain changes in fungal communities on the roots of co-occurring Mediterranean oaks. Soil Biol Biochem 42: 788–796.
-
- Bahram M, Polme S, Koljalg U, Zarre S, Tedersoo L. (2012). Regional and local patterns of ectomycorrhizal fungal diversity and community structure along an altitudinal gradient in the Hyrcanian forests of northern Iran. New Phytol 193: 465–473. - PubMed
-
- Bahram M, Koljalg U, Kohout P, Mirshahvaladi S, Tedersoo L. (2013). Ectomycorrhizal fungi of exotic pine plantations in relation to native host trees in Iran: evidence of host range expansion by local symbionts to distantly related host taxa. Mycorrhiza 23: 11–19. - PubMed
-
- Chao A. (1984). Non-parametric estimation of the number of classes in a population. Scand J Statist 11: 265–270.
-
- Colwell RK, Hurtt GC. (1997). Nonbiological gradients in species richness and a spurious Rapoport effect. Am Nat 144: 570–595.
Publication types
MeSH terms
LinkOut - more resources
Full Text Sources
Other Literature Sources

