. 2014 Sep;8(9):1892-903.
doi: 10.1038/ismej.2014.35. Epub 2014 Mar 13.

Picocyanobacteria containing a novel pigment gene cluster dominate the brackish water Baltic Sea

Affiliations

Picocyanobacteria containing a novel pigment gene cluster dominate the brackish water Baltic Sea

John Larsson et al. ISME J. 2014 Sep.

Abstract

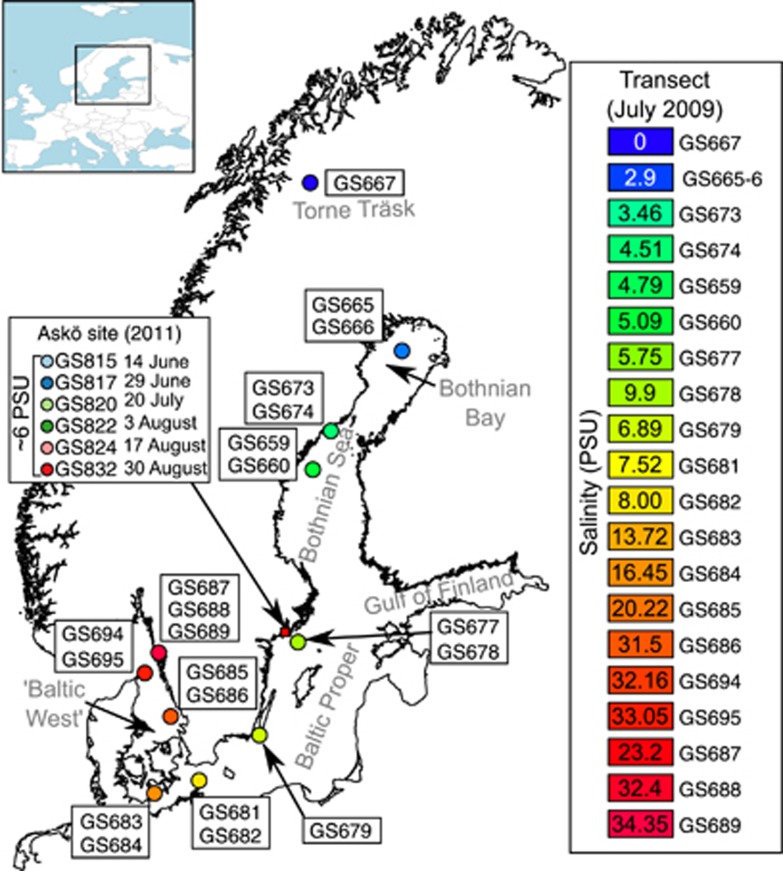
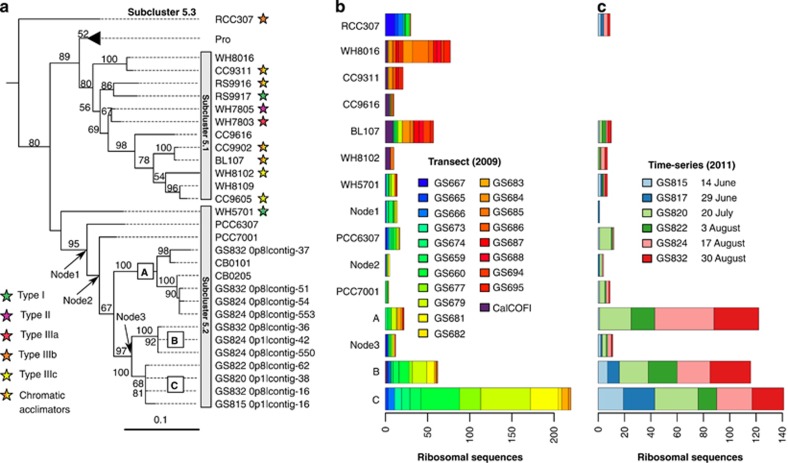
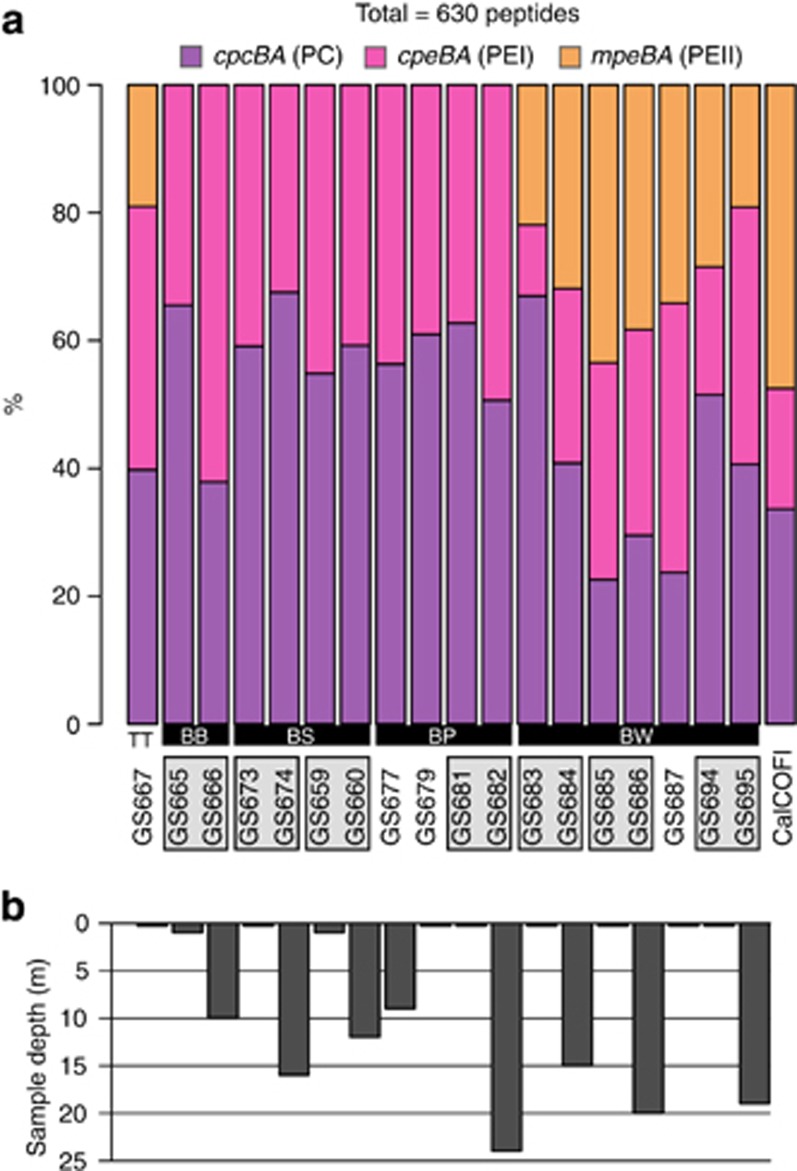
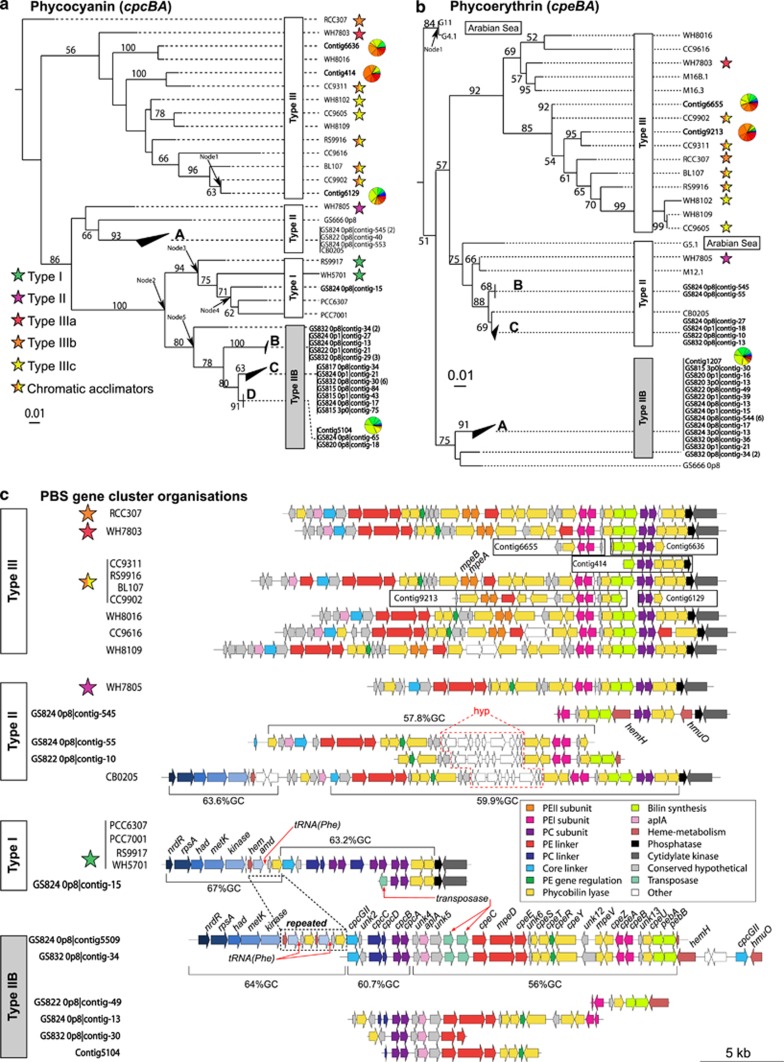
Photoautotrophic picocyanobacteria harvest light via phycobilisomes (PBS) consisting of the pigments phycocyanin (PC) and phycoerythrin (PE), encoded by genes in conserved gene clusters. The presence and arrangement of these gene clusters give picocyanobacteria characteristic light absorption properties and allow the colonization of specific ecological niches. To date, a full understanding of the evolution and distribution of the PBS gene cluster in picocyanobacteria has been hampered by the scarcity of genome sequences from fresh- and brackish water-adapted strains. To remediate this, we analysed genomes assembled from metagenomic samples collected along a natural salinity gradient, and over the course of a growth season, in the Baltic Sea. We found that while PBS gene clusters in picocyanobacteria sampled in marine habitats were highly similar to known references, brackish-adapted genotypes harboured a novel type not seen in previously sequenced genomes. Phylogenetic analyses showed that the novel gene cluster belonged to a clade of uncultivated picocyanobacteria that dominate the brackish Baltic Sea throughout the summer season, but are uncommon in other examined aquatic ecosystems. Further, our data suggest that the PE genes were lost in the ancestor of PC-containing coastal picocyanobacteria and that multiple horizontal gene transfer events have re-introduced PE genes into brackish-adapted strains, including the novel clade discovered here.


Figures

Figure 1
Figure 1
Map of the Baltic Sea area sampling sites. The map shows the location of sampling sites in the transect study conducted in 2009 (GS665–GS695). Samples are colour coded according to salinity (see legend on the right). The Askö site and collection time points for the summer of 2011 (GS815–GS832) are marked on the map and in the left legend. The inset map of Europe shows the location and extent of the Baltic Sea.
Figure 2
Figure 2
Picocyanobacterial phylogeny and distribution. (a) ML phylogeny of six ribosomal proteins found in 126 cyanobacterial genomes and 11 contigs in the 2011 time series assembly. Contig names include the sample id (GS815–GS832), filter fraction (0p1=0.1–0.8 μm, 0p8=0.8–3.0 μm and 3p0=3.0–200 μm) and contig number. Bootstrap support >50% (1000 replicates) are shown at nodes and the scale bar indicates number of expected substitutions per site. The tree was rooted using Gloeobacter violaceus PCC7421 and only the Synechococcus cluster 5 subtree is shown (see the Supplementary material for the full phylogeny). The Prochlorococcus clade has been collapsed. Arrows indicate nodes introduced after phylogenetic placement of sequence reads. The coloured stars indicate pigment type for reference strains (only shown for those studied in Six et al., 2007). See Table 2 for genome abbreviations. (b, c) Distribution of reads from the 2009 transect (b) and 2011 time series (c) in the phylogeny in a. CalCOFI, combined reads from metagenomic samples off the west coast of California (Zeigler Allen et al., 2012).
Figure 3
Figure 3
Proportions of PBS genes. (a) Distribution of PC (cpcBA), PEI (cpeBA) and PEII (mpeBA) subunit genes in the metagenomic data set. The number of genes was normalized against the picocyanobacterial RecA protein and the graph shows the (normalized) relative proportion of each PBS subunit type at each site in the Baltic Sea metagenomic transect. The subbasin/location for samples is indicated by the abbreviations in the lower margin: BB, Bothnian Bay; BS, Bothnian Sea; BP, Baltic Proper; BW, Baltic West; C=CalCOFI (west coast of California); TT, Lake Torne Träsk. (b) Sampling depth at each site.
Figure 4
Figure 4
Phylogeny of phycobiliproteins and structure of the PBS operons. ML phylogenies of concatenated amino-acid alignments of PC (cpcBA) (a) and PE (cpeBA) (b) subunits from reference genomes and assembled contigs from the Baltic Sea metagenomes. The trees were rooted with Gloeobacter violaceus (data not shown). Bootstrap (1000 replicates) support >50% is shown at nodes and the scale bar indicates number of expected substitutions per site. Stars as in Figure 2. For contigs in the 2009 global assembly, pie charts show the read distribution from each site. Numbers in parenthesis next to contigs indicate the number of contigs with identical PC or PE subunits. Arrows show internal nodes introduced by phylogenetic placement of sequence fragments (see Figure 5). (c) PBS operon structures of picocyanobacteria in the data set. Operon schematics are shown for each pigment type and for assembled contigs in the Baltic Sea data set. For contigs that occupy the same position in the PC and PE phylogenies, only the longest contig is shown. The region designated 'hyp' in type II genomes indicates a 4.4-kb stretch of conserved hypothetical genes. amd, predicted amidophosphoribosyltransferase; had, haloacid dehalogenase-like hydrolase; hem, putative heme iron utilization protein; kinase, carbohydrate kinase, FGGY family protein; metK, S-adenosylmethionine synthetase; nrdR, transcriptional regulator NrdR; rpsA, 30S ribosomal protein S1.
Figure 5
Figure 5
Distribution PBS operons inferred from phylogenetic placement of PC and PE subunits. Amino-acid sequences for PC (cpcBA) and PE (cpeBA) sequences were inserted into the respective phylogenetic tree (shown in Figures 4a and b) using the evolutionary placement algorithm in RAxML. Each bar plot shows the distribution of sequences from various samples in the corresponding phylogeny. If sequences were inserted directly on a terminal leaf, the strain/contig name is shown in the plot. For sequences inserted into internal nodes, the node name is given and its position in the tree is shown in Figure 4a or Figure 4b. For collapsed clades, the combined distribution of sequences in the clade is shown. (a, b) PC sequences from the 2009 transect and previous studies (a) and from the 2011 time series (b). (c, d) PE sequences from the 2009 transect and previous studies (c) and from the 2011 time series (d). Pigment type clade designations are shown in boxes with the novel type IIB clade shaded in grey. CalCOFI, West coast of California (California Current); GML, Great Mazurian Lakes; GOF, Gulf of Finland; GS020, Lake Gatun; LB, Lake Balaton; LM, Lake Mondsee.

References

    1. Berger SA, Krompass D, Stamatakis A. Performance, accuracy, and web server for evolutionary placement of short sequence reads under maximum likelihood. Syst Biol. 2011;60:291–302. - PMC - PubMed
    1. Boisvert S, Raymond F, Godzaridis É, Laviolette F, Corbeil J. Ray Meta: scalable de novo metagenome assembly and profiling. Genome Biol. 2012;13:R122. - PMC - PubMed
    1. Clokie MRJ, Mann NH. Marine cyanophages and light. Environ Microbiol. 2006;8:2074–2082. - PubMed
    1. Darriba D, Taboada GL, Doallo R, Posada D. ProtTest 3: fast selection of best-fit models of protein evolution. Bioinforma Oxf Engl. 2011;27:1164–1165. - PMC - PubMed
    1. Doron M, Babin M, Hembise O, Mangin A, Garnesson P. Ocean transparency from space: validation of algorithms estimating Secchi depth using MERIS, MODIS and SeaWiFS data. Remote Sens Environ. 2011;115:2986–3001.

Publication types