

Selection and validation of reference genes for gene expression analysis in switchgrass (Panicum virgatum) using quantitative real-time RT-PCR
- PMID: 24621568
- PMCID: PMC3951385
- DOI: 10.1371/journal.pone.0091474
Selection and validation of reference genes for gene expression analysis in switchgrass (Panicum virgatum) using quantitative real-time RT-PCR
Abstract
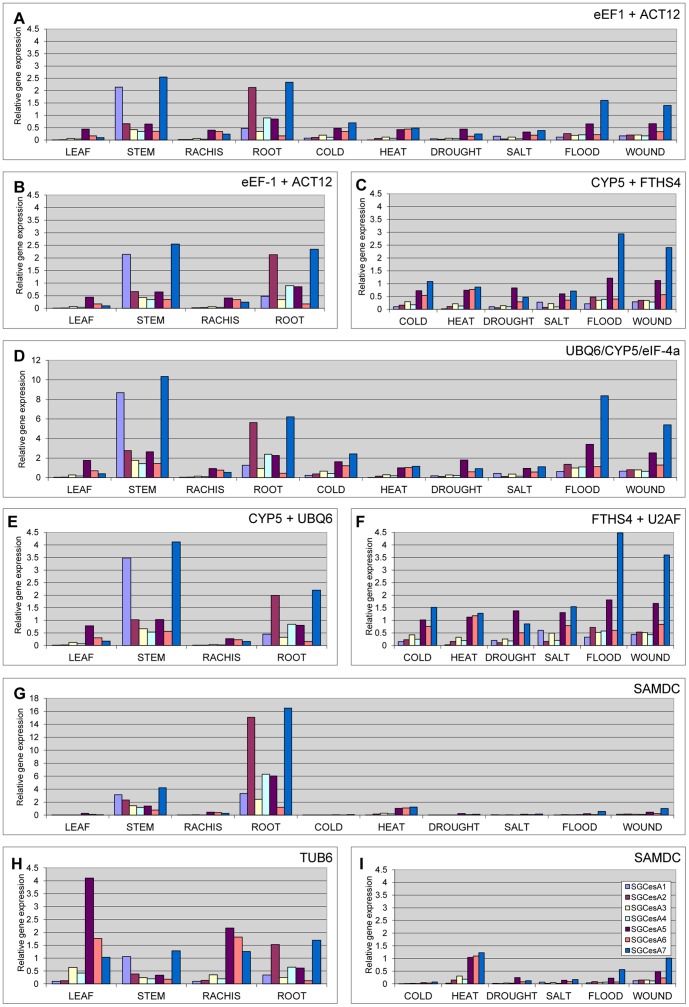
Switchgrass (Panicum virgatum) has received a lot of attention as a forage and bioenergy crop during the past few years. Gene expression studies are in progress to improve new traits and develop new cultivars. Quantitative real time PCR (qRT-PCR) has emerged as an important technique to study gene expression analysis. For accurate and reliable results, normalization of data with reference genes is essential. In this work, we evaluate the stability of expression of genes to use as reference for qRT-PCR in the grass P. virgatum. Eleven candidate reference genes, including eEF-1α, UBQ6, ACT12, TUB6, eIF-4a, GAPDH, SAMDC, TUA6, CYP5, U2AF, and FTSH4, were validated for qRT-PCR normalization in different plant tissues and under different stress conditions. The expression stability of these genes was verified by the use of two distinct algorithms, geNorm and NormFinder. Differences were observed after comparison of the ranking of the candidate reference genes identified by both programs but eEF-1α, eIF-4a, CYP5 and U2AF are ranked as the most stable genes in the samples sets under study. Both programs discard the use of SAMDC and TUA6 for normalization. Validation of the reference genes proposed by geNorm and NormFinder were performed by normalization of transcript abundance of a group of target genes in different samples. Results show similar expression patterns when the best reference genes selected by both programs were used but differences were detected in the transcript abundance of the target genes. Based on the above research, we recommend the use of different statistical algorithms to identify the best reference genes for expression data normalization. The best genes selected in this study will help to improve the quality of gene expression data in a wide variety of samples in switchgrass.
Conflict of interest statement
Figures


References
-
- Parrish D, Fike J (2005) The biology and agronomy of switchgrass for biofuels. Critical Reviews in Plant Sciences: 423–459.
-
- Muir JP, Sanderson MA, Ocumpaugh WR, Jones RM, Reed RL (2001) Biomass production of ‘Alamo’ switchgrass in response to nitrogen, phosphorus, and row spacing. Agronomy Journal 93: 896–901.
-
- Heaton E, Voigt T, Long SP (2004) A quantitative review comparing the yields of two candidate C-4 perennial biomass crops in relation to nitrogen, temperature and water. Biomass & Bioenergy 27: 21–30.
-
- Vogel KP, Brejda JJ, Walters DT, Buxton DR (2002) Switchgrass biomass production in the Midwest USA: Harvest and nitrogen management. Agronomy Journal 94: 413–420.
Publication types
MeSH terms
Substances
LinkOut - more resources
Full Text Sources
Other Literature Sources
Research Materials
Miscellaneous
