. 2014 Mar 12;9(3):e91646.
doi: 10.1371/journal.pone.0091646. eCollection 2014.

New miRNA profiles accurately distinguish renal cell carcinomas and upper tract urothelial carcinomas from the normal kidney

Affiliations

New miRNA profiles accurately distinguish renal cell carcinomas and upper tract urothelial carcinomas from the normal kidney

Apostolos Zaravinos et al. PLoS One. .

Erratum in

  • PLoS One. 2014;9(6):e100063

Abstract

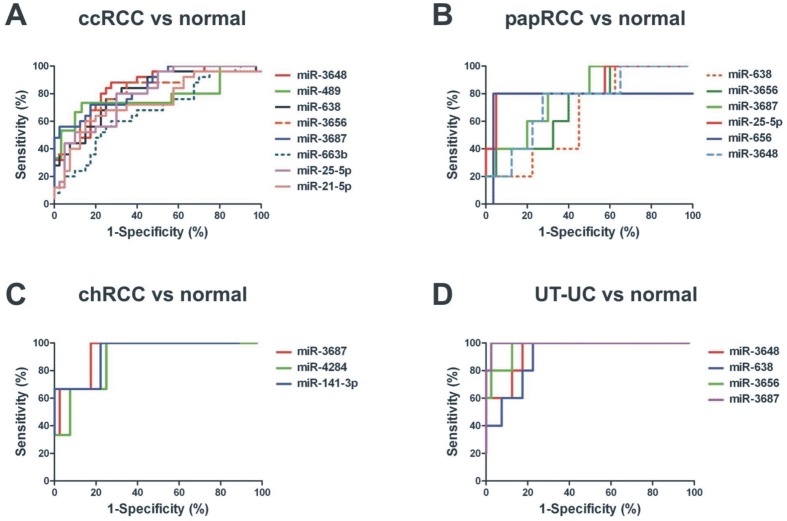
Background: Upper tract urothelial carcinomas (UT-UC) can invade the pelvicalyceal system making differential diagnosis of the various histologically distinct renal cell carcinoma (RCC) subtypes and UT-UC, difficult. Correct diagnosis is critical for determining appropriate surgery and post-surgical treatments. We aimed to identify microRNA (miRNA) signatures that can accurately distinguish the most prevalent RCC subtypes and UT-UC form the normal kidney.

Methods and findings: miRNA profiling was performed on FFPE tissue sections from RCC and UT-UC and normal kidney and 434 miRNAs were significantly deregulated in cancerous vs. the normal tissue. Hierarchical clustering distinguished UT-UCs from RCCs and classified the various RCC subtypes among them. qRT-PCR validated the deregulated expression profile for the majority of the miRNAs and ROC analysis revealed their capability to discriminate between tumour and normal kidney. An independent cohort of freshly frozen RCC and UT-UC samples was used to validate the deregulated miRNAs with the best discriminatory ability (AUC>0.8, p<0.001). Many of them were located within cytogenetic regions that were previously reported to be significantly aberrated. miRNA targets were predicted using the miRWalk algorithm and ingenuity pathway analysis identified the canonical pathways and curated networks of the deregulated miRNAs. Using the miRWalk algorithm, we further identified the top anti-correlated mRNA/miRNA pairs, between the deregulated miRNAs from our study and the top co-deregulated mRNAs among 5 independent ccRCC GEO datasets. The AB8/13 undifferentiated podocyte cells were used for functional assays using luciferase reporter constructs and the developmental transcription factor TFCP2L1 was proved to be a true target of miR-489, which was the second most upregulated miRNA in ccRCC.

Conclusions: We identified novel miRNAs specific for each RCC subtype and UT-UC, we investigated their putative targets, the networks and pathways in which they participate and we functionally verified the true targets of the top deregulated miRNAs.


Conflict of interest statement

Competing Interests: The authors have declared that no competing interests exist.

Figures

Figure 1
Figure 1. Haematoxylin and eosin (H&E) staining and immunohistochemistry (IHC).
Upper pannel: Representative H&E staining from ccRCC, papRCC, chRCC and normal kidney tissue. About 5–10 serial tissue sections of 10 μm were cut from each FFPE block, deparaffinized with xylene, hydrated and stained with H&E before microscopic examination. When the proportion of tumour cells was >70% the FFPE block was subjected to total RNA extraction. Lower pannel: IHC of FFPE tissue sections using anti-vimentin as primary antibody. Vimentin was predominantly seen in ccRCC and papRCC (∼70% and ∼50%, respectively), but only rarely in chRCC (4%) and absent in the normal kidney. Vimentin was also down-regulated in the majority of UT-UC cases.
Figure 2
Figure 2. microRNA profiling.
Four-hundred and thirty-four miRNAs were statistically significantly deregulated in all RCC subtypes and UT-UC versus the normal kidney. (A) Q-Q (quantile-quantile) plot. Red circles indicate the significantly deregulated miRNAs. (B) Frequencies of the t-scores and p-values. The deregulated miRNAs had a p<0.05. (C) The volcano-plot depicts the 434 statistically significantly deregulated miRNAs in ccRCC, papRCC, chRCC and UT-UC versus the normal kidney, of which the majority was significantly down-regulated in the cancerous tissue compared to the latter. (D) FDR diagram depicting the percentage of FDR with respect to p-value along with a plot of the estimated a priori probability that the null hypothesis π(0), is true versus the tuning parameter, lambda, λ, with a cubic polynomial fitting curve.
Figure 3
Figure 3. Hierarchical Clustering (HCl).
The unsupervised two-way HCl with Euclidian distance depicts differential miRNA expression in ccRCC, papRCC, chRCC and UT-UC. The log2 fold change in each RCC subtype and UT-UC versus the normal kidney tissue was used to construct the heat map. miRNA profiling accurately discriminated between RCC and UT-UC, as well as among ccRCC, papRCC and chRCC. ccRCC, clear cell renal cell carcinoma; papRCC, papillary renal cell carcinoma; chRCC, chromophobe renal cell carcinoma; UT-UC, upper tract urothelial carcinoma. Red and blue colours show significant up- or down-regulation of each miRNA in the tumour versus the normal kidney, respectively.
Figure 4
Figure 4. Overlapping relationship of the deregulated miRNAs.
Venn diagrams illustrate the overlapping relationship of the number of up-regulated miRNAs among RCC subtypes (A), down-regulated miRNAs among RCC subtypes (B), up-regulated miRNAs among RCC subtypes and UT-UCs (C), down-regulated miRNAs between RCC subtypes and UT-UCs (D). Ninety-four miRNAs were co-upregulated among ccRCC, papRCC and chRCC; and 11, 44 and 24 miRNAs were specifically up-regulated in each one of the three RCC subtypes (ccRCC, chRCC and papRCC), respectively. On the other hand, 222 miRNAs were co-down-regulated in the three RCC subtypes, whereas 16, 18 and 5 miRNAs were specifically down-regulated in ccRCC, chRCC and papRCC, respectively. When the DE miRNAs in each RCC subtype were combined with those in UT-UC, we identified 89 and 206 miRNAs that were up- and down-regulated, respectively in all tumor types.
Figure 5
Figure 5. ROC analysis using microarray data.
ROC curves of the top 30 up-regulated miRNAs in each tissue type using the microarray expression data. Of them, the miRNAs with a p<0.01 and an AUC>0.8 were selected as successful distinguishing markers between cancerous and normal tissues. The median area under the curve (AUC) for ccRCC was 0.85 (A); for papRCC, median AUC = 0.94 (B); for chRCC, median AUC = 0.84 (C) and for UT-UC, median AUC = 0.94 (D).
Figure 6
Figure 6. qRT-PCR validation of the top 25 deregulated miRNAs.
The Volcano-plots depict the significantly deregulated miRNAs in ccRCC, papRCC, chRCC and UT-UC. Eight miRNAs were significantly up-regulated in ccRCC, 5 in papRCC, 3 in chRCC and 4 in UT-UC. On the other hand, miR-656 was significantly down-regulated in papRCC; miR-155-3p, miR-106b-3p, miR-140-5p and miR-656 were significantly down-regulated in chRCC; and miR-520g was significantly down-regulated in UT-UC. The threshold of statistically significant difference was set at p<0.05 and log2 fold change>2.
Figure 7
Figure 7. ROC analysis using qRT-PCR data.
ROC curves of the significantly deregulated miRNAs, using the expression data from qRT-PCR analysis. Of them, the miRNAs with a p<0.01 and an AUC>0.8 were selected as successful distinguishing markers between cancerous and normal kidney tissues. The median area under the curve (AUC) for ccRCC was 0.802 (A); for papRCC, median AUC = 0.756 (B); for chRCC, median AUC = 0.926 (C) and for UT-UC, median AUC = 0.955 (D).
Figure 8
Figure 8. Correlation between microarrays and qRT-PCR.
Median log2 fold change expression levels of the 14 most up-regulated and 11 most down-regulated miRNAs between ccRCC, papRCC, chRCC and UT-UC and the normal kidney tissue, as determined by both qRT-PCR and microarray analysis. As shown in the figure, qRT-PCR and microarray results were highly compatible. The most identical results between the two techniques were those for ccRCC, which was expected due to the high sample number (Pearson’s CC = 0.778, p<0.001). The qRT-PCR results for papRCC, chRCC and UT-UC also revealed similar deregulation patterns with those of the microarray experimentation, however the correlation coefficients were lower, apparently due to small sample number (in papRCC, CC = 0.596, p = 0.002; in chRCC CC = 0.570, p = 0.003; in UT-UC, CC = 0.517, p = 0.009).
Figure 9
Figure 9. Validation in a blinded independent cohort.
A blinded independent validation cohort composed of 40 freshly frozen ccRCC, papRCC, chRCC, UT-UC and normal kidney samples was also used to validate the discriminatory ability of the qRT-PCR verified deregulated miRNAs. The results were highly repeatable between the two cohorts, recapitulating the specificity of these miRNAs in each tumour group.
Figure 10
Figure 10. Locked Nucleic Acids-In Situ Hybridization (LNA-ISH).
LNA-ISH for miR-25-5p in ccRCC (A), papRCC (B), chRCC (C) and UT-UC (D). miR-25-5p was confined to the cytoplasm both in normal and tumour sections. The nuclear expression of U6 snRNA (positive control) was confirmed in all the patient samples, whereas the scrambled oligonucleotide was negative in all samples. miR-25-5p high expression was confirmed in all ccRCC sections by LNA-ISH. ccRCCs of high stage and grade stained stronger miR-25-5p compared to lower stage and grade ccRCCs. Each ccRCC section was compared against its corresponding normal kidney section (A). papRCCs of type II stained stronger for miR-25-5p compared to type I papRCCs (B). Validating the qRT-PCR results, miR-25-5p did not stain stronger in chRCC sections vs. the normal tissue ones. This was also confirmed for chRCCs with focal sarcomatoid differentiation, suggesting that miR-25-5p does not play any role in the metastatic behavior of the tumour (C). Verifying the qRT-PCR results, miR-25-5p was not significantly stronger in UT-UC vs. the normal tissue sections (D).
Figure 11
Figure 11. Correlation of miRNA deregulation and chromosomal aberrations.
Chromosomal mapping for the deregulated miRNAs in ccRCC (A), papRCC (B), chRCC (C) and UT-UC (D). In ccRCC, the up-regulated miRNAs were mainly mapped on chromosomes Xq, 17q, 5q, 14q, 19q, 11q, 12q, 3p and 10p (in descending order); whereas the down-regulated ones were mainly mapped on chromosomes 14q, 19q, Xq, 8q, 1p, 17q, 7q, 3q, 10q, 12q and 2q (A). In papRCC, the up-regulated miRNAs were mainly mapped on chromosomes 19q, 14q, Xq, 5q, 3p, 16p, 11q, 9q and 15q; whereas the down-regulated miRNAs were mainly mapped on chromosomes 14q, 19q, Xq, 1p, 7q, 8q, 12q, 10q, 17q, 3q, 19p, Xp, 2q, 5, 6q, 4q, 11q, 15q and 20q (B). In chRCC, the up-regulated miRNAs were mainly mapped on chromosomes 14q, Xq, 19q, 17q, 5q, 7q, 11q, 15q, 2q and 12q; whereas the down-regulated ones were mainly mapped on chromosomes 14q, 19q, Xp, 3p, 8q, 17q, 3q, 10q, 12q, 4q, 7q, 3p, 5q, 19p and 20q (C). In UT-UC, the up-regulated miRNAs were mostly mapped on chromosomes 17q, 19q, 11q, 16p, 5q, 14q, 15q, Xq, 1p and 3p; whereas the down-regulated miRNAs were mainly mapped on chromosomes 14q, 19q, Xq, 8q, 1p, 7q, 12q, 3q, 10q, 5q, 17p, 19p, Xp, 2q, 4q, 3p and 8p (D).
Figure 12
Figure 12. Ingenuity pathway analysis (IPA).
A. In ccRCC, the most important biological functions of the top deregulated miRNAs were: 1) Cancer (p = 8.71E-11-4.91E-02); 2) Renal and Urological Disease (p = 8.71E-11-2.12E-09); 3) Inflammatory Disease (p = 2.12E-09-2.14E-03); 4) Inflammatory Response (p = 2.12E-09-2.4E-04) and 5) Reproductive System Disease (p = 3.37E-05-2.58E-02). The associated functions of the major miRNA network (score = 30) were: Inflammatory disease, inflammatory response, renal inflammation. Argonaute RISC catalytic component 2 (EIF2C2), tumour protein p53 (TP53), v-myc myelocytomatosis viral oncogene homolog (MYC) and EPH receptor B6 (EPHB6) constituted some of the major central nodes in this network. B. In papRCC, the most important biological functions of the top deregulated miRNAs were: 1) Cancer (p = 9.4E-09-4.15E-02); 2) Endocrine System Disorders (p = 9.4E-09-4.54E-02); 3) Reproductive System Disease (p = 9.4E-09-5.11E-03); 4) Inflammatory Disease (p = 2.17E-06-2.17E-06) and 5) Inflammatory Response (p = 2.17E-06-1.65E-03). The associated functions of the major miRNA network (score = 22) were: Endocrine System Disorders, Reproductive System Disease, Cellular Development. Tumour protein p53 (TP53) and EPH receptor B6 (EPHB6) constituted some of the major central nodes in this network. C. In chRCC, the most important biological functions of the top deregulated miRNAs were: 1) Cancer (p = 8.99E-07-4.73E-02); 2) Inflammatory Disease (p = 1.64E-06-1.64E-06); 3) Inflammatory Response (p = 1.64E-06-1.19E-03); 4) Renal and Urological Disease (p = 1.64E-06-7.96E-03) and 5) Reproductive System Disease (p = 3.02E-04-2.39E-02). The associated functions of the major miRNA network (score = 22) were: Hereditary Disorder, Skeletal and Muscular Disorders, Developmental Disorder. Tumour protein p53 (TP53), B-cell CLL/lymphoma 2 (BCL2) vascular endothelial growth factor A (VEGFA) and v-myc myelocytomatosis viral oncogene homolog (MYC) constituted some of the major central nodes in this network. D. In UT-UC, the most important biological functions of the top deregulated miRNAs were: 1) Inflammatory Disease (p = 2.7E-12-3.42E-02); 2) Inflammatory Response (p = 2.7E-12-1.75E-05); 3) Renal and Urological Disease (p = 2.7E-12-3.35E-09); 4) Cancer (p = 4.67E-10-4.53E-02) and 5) Reproductive System Disease (p = 3.82E-06-4.96E-02). The associated functions of the 2 major miRNA networks were: 1) Connective Tissue Disorders, Inflammatory Disease, Inflammatory Response (score = 25); and 2) Cancer, Reproductive System Disease, Renal and Urological Disease (score = 24). Insulin, hydrogen peroxide and ribosomal protein S15 (RPS15) constituted some of the major central nodes in the first network; whereas tumour protein p53 (TP53) constituted a central node in the second network.
Figure 13
Figure 13. Western blotting.
A. Normalized luciferase relative light units (RLUs) in AB8/13 cell lysates after transfection with sensor constructs. Co-transfection of pMIR-REPORT-TFCP2L1 with either miR-489 mimic or inhibitor resulted in significant reduction or increase in luciferase expression versus the negative control, respectively, indicating that miR-489 binds directly on the 3′UTR of TFCP2L1 (***, p<0.001; **p<0.05, ANOVA). B. Western blot of TFCP2L1 from AB8/13 cells after transient transfection with miR-489 miRNA LNA mimics, Inhibitors and the AllStars™ Negative Control scrambled sequence LNA. This is a representative of three experiments.The statistical analysis of western blot densitometry results, normalized against the Negative Control is also depicted. Values represent the mean ± SEM. Results illustrate the reduction of TFCP2L1 protein levels at the presence of miR-489 mimics (*, p = 0.026), while miRNA Inhibitors significantly increased TFCP2L1 levels (*, p = 0.039).

References

    1. Meloni-Ehrig AM (2002) Renal cancer: cytogenetic and molecular genetic aspects. Am J Med Genet 115: 164–172. - PubMed
    1. Ficarra V, Martignoni G, Galfano A, Novara G, Gobbo S, et al. (2006) Prognostic role of the histologic subtypes of renal cell carcinoma after slide revision. Eur Urol 50: 786–793. - PubMed
    1. Lopez-Beltran A, Kirkali Z, Cheng L, Egevad L, Regueiro JC, et al. (2008) Targeted therapies and biological modifiers in urologic tumors: pathobiology and clinical implications. Semin Diagn Pathol 25: 232–244. - PubMed
    1. Tazi el M, Essadi I, Tazi MF, Ahellal Y, M'Rabti H, et al. (2011) Advanced treatments in non-clear renal cell carcinoma. Urol J 8: 1–11. - PubMed
    1. Youssef YM, White NMA, Grigull J, Krizova A, Samy C, et al. (2011) Accurate molecular classification of kidney cancer subtypes using microRNA signature. Eur Urol 59: 721–730. - PubMed

Publication types