

The LDL-HDL profile determines the risk of atherosclerosis: a mathematical model
- PMID: 24621857
- PMCID: PMC3951264
- DOI: 10.1371/journal.pone.0090497
The LDL-HDL profile determines the risk of atherosclerosis: a mathematical model
Abstract
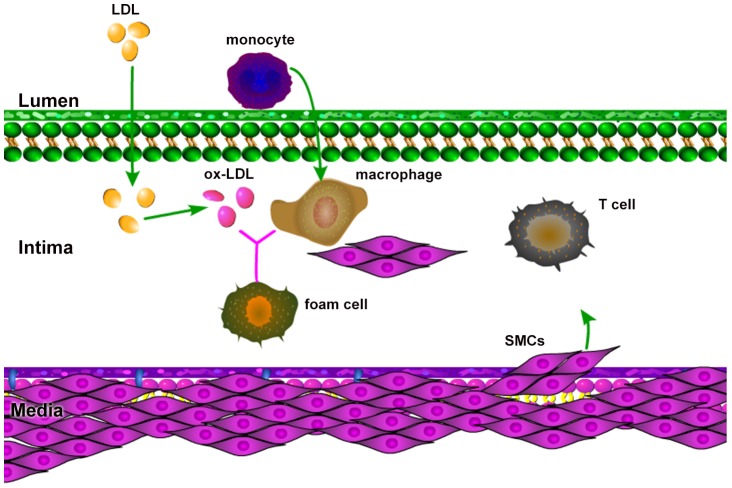
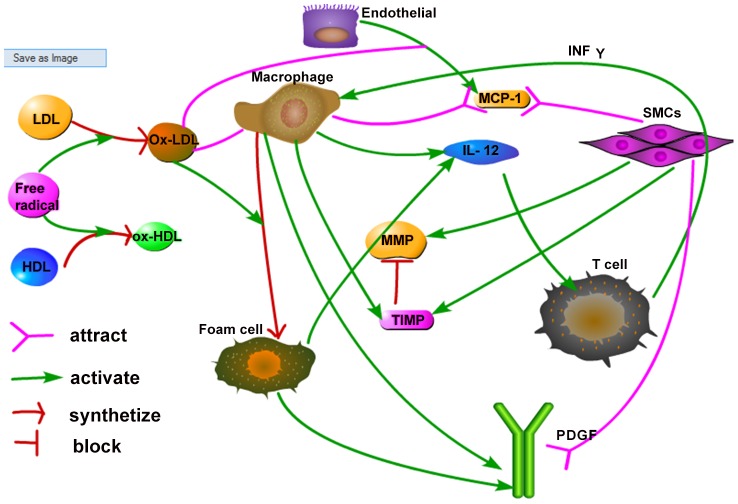
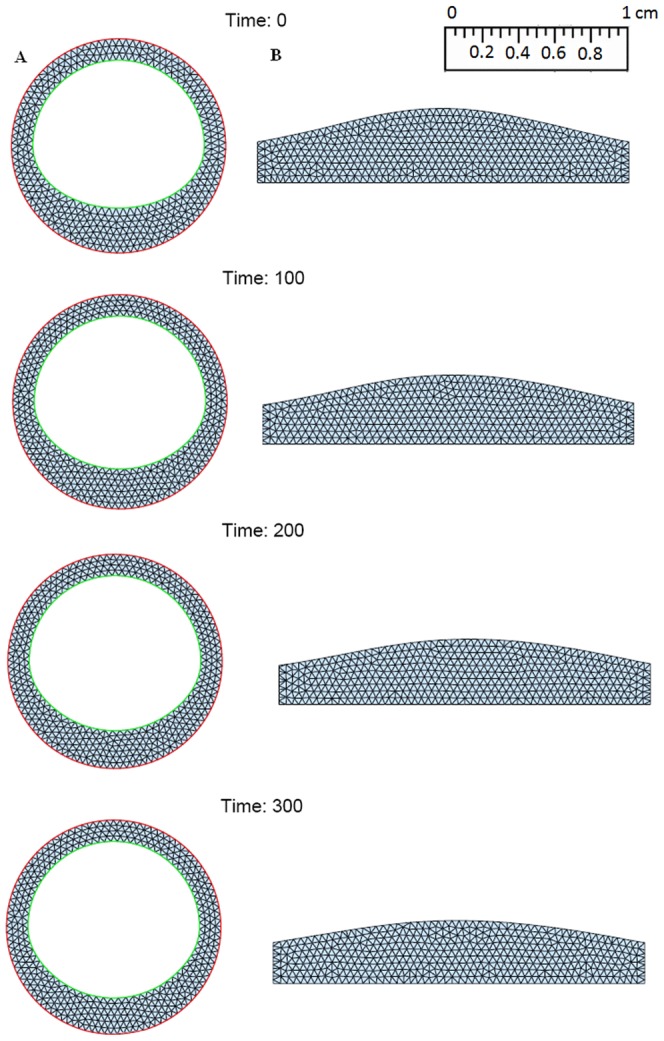
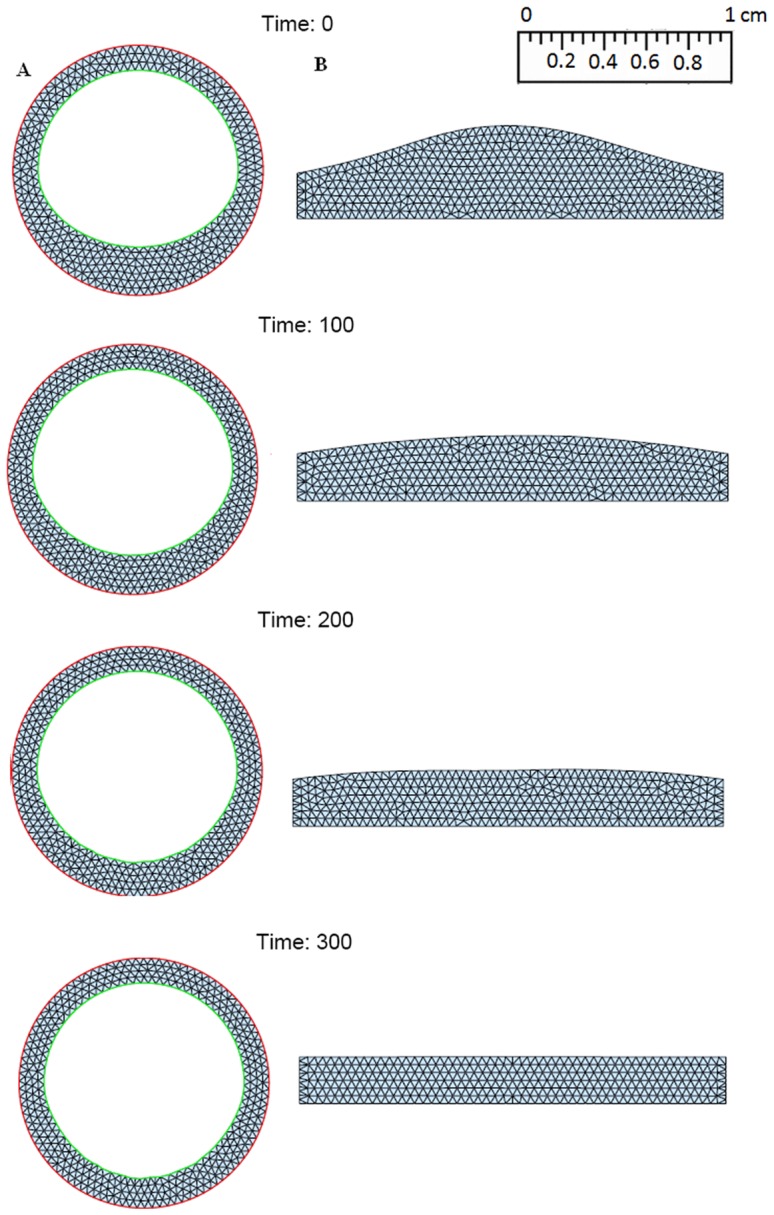
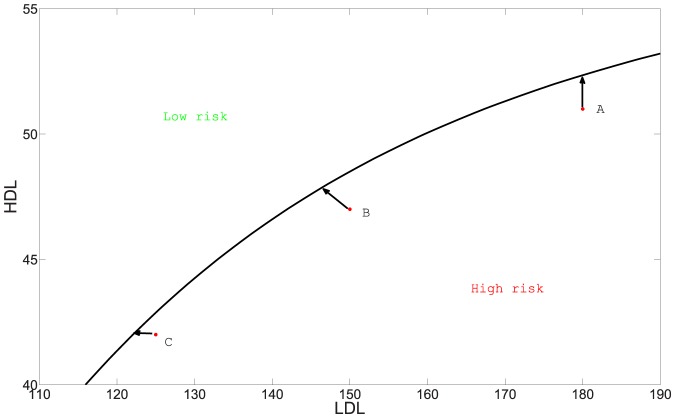
Atherosclerosis, the leading death in the United State, is a disease in which a plaque builds up inside the arteries. As the plaque continues to grow, the shear force of the blood flow through the decreasing cross section of the lumen increases. This force may eventually cause rupture of the plaque, resulting in the formation of thrombus, and possibly heart attack. It has long been recognized that the formation of a plaque relates to the cholesterol concentration in the blood. For example, individuals with LDL above 190 mg/dL and HDL below 40 mg/dL are at high risk, while individuals with LDL below 100 mg/dL and HDL above 50 mg/dL are at no risk. In this paper, we developed a mathematical model of the formation of a plaque, which includes the following key variables: LDL and HDL, free radicals and oxidized LDL, MMP and TIMP, cytockines: MCP-1, IFN-γ, IL-12 and PDGF, and cells: macrophages, foam cells, T cells and smooth muscle cells. The model is given by a system of partial differential equations with in evolving plaque. Simulations of the model show how the combination of the concentrations of LDL and HDL in the blood determine whether a plaque will grow or disappear. More precisely, we create a map, showing the risk of plaque development for any pair of values (LDL,HDL).
Conflict of interest statement
Figures
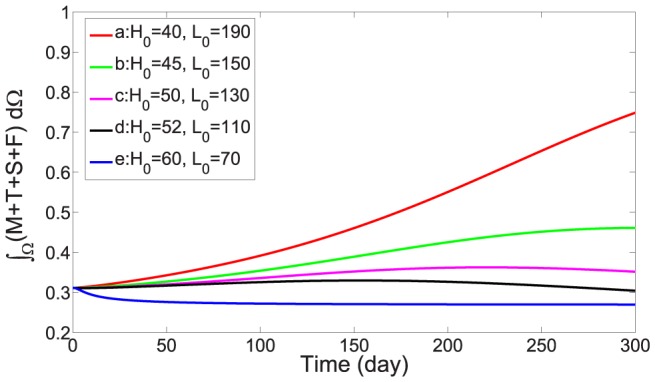
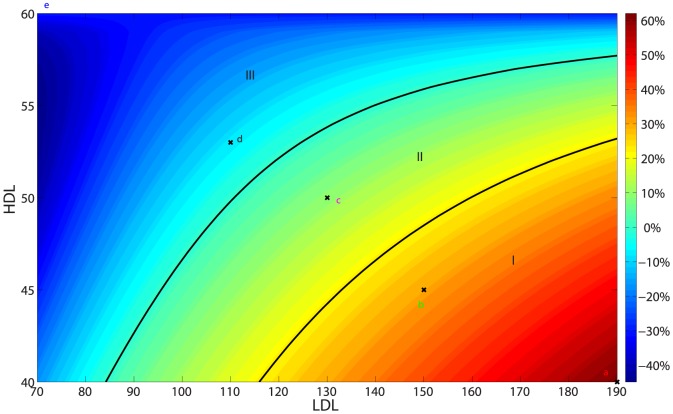
 whose plaque's weight was simulated in Fig. 7 over a period of 300 days are indicated by “x”.
Similar articles
-
Nonlinear dynamics of early atherosclerotic plaque formation may determine the efficacy of high density lipoproteins (HDL) in plaque regression.PLoS One. 2017 Nov 21;12(11):e0187674. doi: 10.1371/journal.pone.0187674. eCollection 2017. PLoS One. 2017. PMID: 29161303 Free PMC article.
-
HDL and plaque regression in a multiphase model of early atherosclerosis.Math Biosci. 2024 Jul;373:109208. doi: 10.1016/j.mbs.2024.109208. Epub 2024 May 15. Math Biosci. 2024. PMID: 38759951
-
High-density lipoprotein or cyclodextrin extraction of cholesterol from aggregated LDL reduces foam cell formation.J Cell Sci. 2019 Dec 2;132(23):jcs237271. doi: 10.1242/jcs.237271. J Cell Sci. 2019. PMID: 31719160 Free PMC article.
-
Atherosclerosis and transit of HDL through the lymphatic vasculature.Curr Atheroscler Rep. 2013 Sep;15(9):354. doi: 10.1007/s11883-013-0354-4. Curr Atheroscler Rep. 2013. PMID: 23912686 Free PMC article. Review.
-
An integrated approach to simulating the vulnerable atherosclerotic plaque.Am J Physiol Heart Circ Physiol. 2020 Oct 1;319(4):H835-H846. doi: 10.1152/ajpheart.00174.2020. Epub 2020 Aug 14. Am J Physiol Heart Circ Physiol. 2020. PMID: 32795179 Free PMC article. Review.
Cited by
-
Macrophage polarization as a potential therapeutic target for atherosclerosis: a dynamic stochastic modelling study.R Soc Open Sci. 2022 Aug 3;9(8):220239. doi: 10.1098/rsos.220239. eCollection 2022 Aug. R Soc Open Sci. 2022. PMID: 35950200 Free PMC article.
-
Nonlinear dynamics of early atherosclerotic plaque formation may determine the efficacy of high density lipoproteins (HDL) in plaque regression.PLoS One. 2017 Nov 21;12(11):e0187674. doi: 10.1371/journal.pone.0187674. eCollection 2017. PLoS One. 2017. PMID: 29161303 Free PMC article.
-
Metabolic and morphometric changes in Indonesian cynomolgus monkeys (Macaca fascicularis) fed an atherogenic diet composed of locally sourced ingredients.Vet World. 2018 Nov;11(11):1609-1617. doi: 10.14202/vetworld.2018.1609-1617. Epub 2018 Nov 22. Vet World. 2018. PMID: 30587897 Free PMC article.
-
Iron and thiols as two major players in carcinogenesis: friends or foes?Front Pharmacol. 2014 Aug 28;5:200. doi: 10.3389/fphar.2014.00200. eCollection 2014. Front Pharmacol. 2014. PMID: 25221514 Free PMC article. Review.
-
A mathematical model of aortic aneurysm formation.PLoS One. 2017 Feb 17;12(2):e0170807. doi: 10.1371/journal.pone.0170807. eCollection 2017. PLoS One. 2017. PMID: 28212412 Free PMC article.
References
-
- Hoyert DL, Xu J (2012) Deaths: Preliminary Data for 2011, National Vital Statistics Reports 61. - PubMed
-
- The top 10 causes of death. Available: http://www.who.int/mediacentre/factsheets/fs310/en/. Accessed 2013 Dec. 18.
-
- Frink RJ (2002) Inflammatory Atherosclerosis, Heart Research Foundation.
-
- Moreno PR (2010) Vulnerable Plaque: Definition, Diagnosis, and Treatment. Cardiology Clinics 28: 1–30. - PubMed
-
- Libby P, Ridker PM, Maseri A (2002) Inflammation and Atherosclerosis. Circulation 105: 1135–1143. - PubMed
Publication types
MeSH terms
Substances
LinkOut - more resources
Full Text Sources
Other Literature Sources
Medical
Research Materials
Miscellaneous
