Clinical Trial
. 2014 Mar 12;9(3):e91366.
doi: 10.1371/journal.pone.0091366. eCollection 2014.

Phase I randomized clinical trial of VRC DNA and rAd5 HIV-1 vaccine delivery by intramuscular (i.m.), subcutaneous (s.c.) and intradermal (i.d.) administration (VRC 011)

Collaborators, Affiliations
Clinical Trial

Phase I randomized clinical trial of VRC DNA and rAd5 HIV-1 vaccine delivery by intramuscular (i.m.), subcutaneous (s.c.) and intradermal (i.d.) administration (VRC 011)

Mary E Enama et al. PLoS One. .

Abstract

Background: Phase 1 evaluation of the VRC HIV DNA and rAd5 vaccines delivered intramuscularly (i.m.) supported proceeding to a Phase 2 b efficacy study. Here we report comparison of the i.m., subcutaneous (s.c.) and intradermal (i.d.) routes of administration.

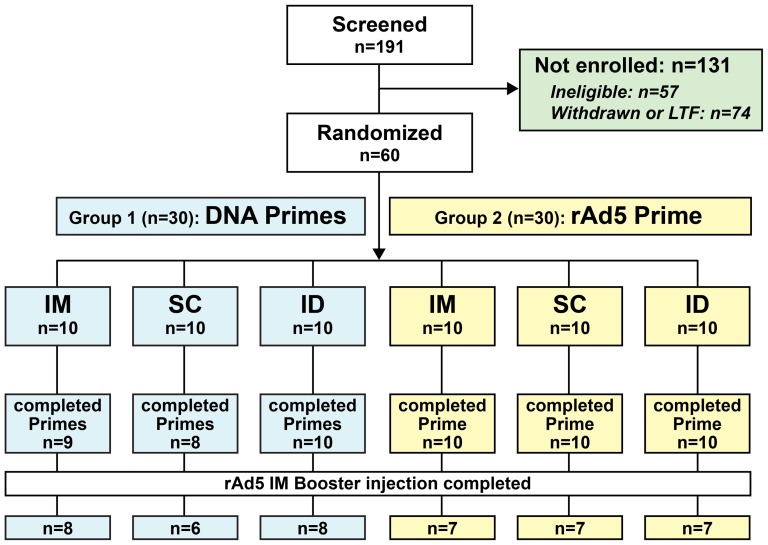
Methods: Sixty subjects were randomized to 6 schedules to evaluate the i.m., s.c. or i.d. route for prime injections. Three schedules included DNA primes (Wks 0,4,8) and 3 schedules included rAd5 prime (Wk0); all included rAd5 i.m. boost (Wk24). DNA vaccine dosage was 4 mg i.m. or s.c., but 0.4 mg i.d., while all rAd5 vaccinations were 1010 PU. All injections were administered by needle and syringe.

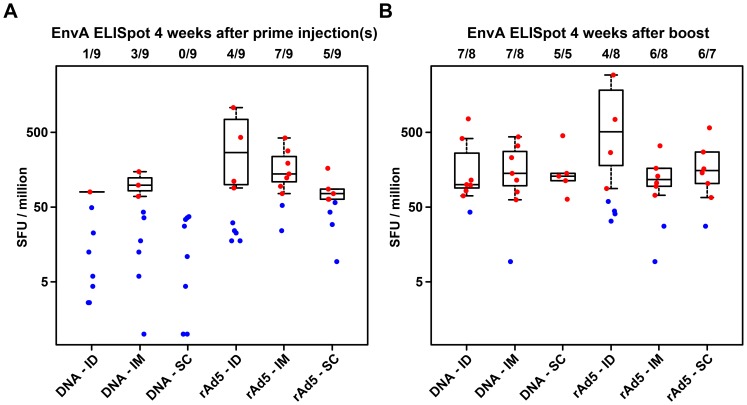
Results: Overall, 27/30 subjects completed 3 DNA primes; 30/30 subjects completed rAd5 primes. Mild local pruritus (itchiness), superficial skin lesions and injection site nodules were associated with i.d. and s.c., but not i.m. injections. All routes induced T-cell and antibody immune responses after rAd5 boosting. Overall, >95% had Env antibody and >80% had Env T-cell responses.

Conclusions: The pattern of local reactogenicity following i.d. and s.c. injections differed from i.m. injections but all routes were well-tolerated. There was no evidence of an immunogenicity advantage following s.c. or i.d. delivery, supporting i.m. delivery as the preferred route of administration.

Trial registration: Clinicaltrials.gov NCT00321061.


Conflict of interest statement

Competing Interests: Gary J. Nabel is named on patent applications for this vaccine concept.

Figures

Figure 1
Figure 1. VRC 011 Disposition Flow Diagram of Screening, Randomization and Vaccination Completion.
Figure 2
Figure 2. ELISpot responses among the different groups after priming with vaccine and route indicated on X-axis (panel A) and after rAd5 boosting IM (panel B).
The numbers above each boxplot represent the fraction of participants in each group with available data at that time point who were judged to be responders using predefined criteria. The responders are represented on the plot with red dots, and are used to construct the boxplots; blue points represent non-responders and are not included in the boxplots.
Figure 3
Figure 3. ICS responses among the different priming groups after boosting with rAd5 IM for CD4 T cells (A) and CD8 T cells (B).
The numbers above each boxplot represent the fraction of participants in each group with available data at that time point who were judged to be responders using predefined positivitycriteria. The responders are represented on the plot with red dots, and are used to construct the boxplots; blue points represent non-responders and are not included in the boxplots.
Figure 4
Figure 4. ELISA responses among the different groups after priming by route and vaccine indicated on X-axis (A) and boosting with rAd5 IM (B).
The numbers above each boxplot represent the fraction of participants in each group with available data at that time point who were judged to be responders using predefined criteria. The responders are represented on the plot with red dots, and are used to construct the boxplots; blue points represent non-responders and are not included in the boxplots.

Similar articles

Cited by

References

    1. Graham BS, Koup RA, Roederer M, Bailer RT, Enama ME, et al. (2006) Phase 1 safety and immunogenicity evaluation of a multiclade HIV-1 DNA candidate vaccine. J Infect Dis 194: 1650–1660. - PMC - PubMed
    1. Catanzaro AT, Koup RA, Roederer M, Bailer RT, Enama ME, et al. (2006) Phase 1 safety and immunogenicity evaluation of a multiclade HIV-1 candidate vaccine delivered by a replication-defective recombinant adenovirus vector. J Infect Dis 194: 1638–1649. - PMC - PubMed
    1. Catanzaro AT, Roederer M, Koup RA, Bailer RT, Enama ME, et al. (2007) Phase I clinical evaluation of a six-plasmid multiclade HIV-1 DNA candidate vaccine. Vaccine 25: 4085–4092. - PubMed
    1. Koup RA, Roederer M, Lamoreaux L, Fischer J, Novik L, et al. (2010) Priming Immunization with DNA Augments Immunogenicity of Recombinant Adenoviral Vectors for Both HIV-1 Specific Antibody and T-Cell Responses. PLoS One 5: e9015. - PMC - PubMed
    1. Hammer SM, Sobieszczyk ME, Janes H, Karuna ST, Mulligan MJ, et al. (2013) Efficacy trial of a DNA/rAd5 HIV-1 preventive vaccine. N Engl J Med 369: 2083–2092. - PMC - PubMed

Publication types

MeSH terms

Associated data