. 2014 May 15;123(20):3105-15.
doi: 10.1182/blood-2013-07-515619. Epub 2014 Mar 12.

Total body irradiation causes long-term mouse BM injury via induction of HSC premature senescence in an Ink4a- and Arf-independent manner

Affiliations

Total body irradiation causes long-term mouse BM injury via induction of HSC premature senescence in an Ink4a- and Arf-independent manner

Lijian Shao et al. Blood. .

Abstract

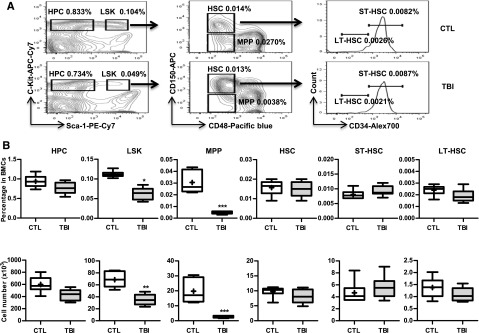
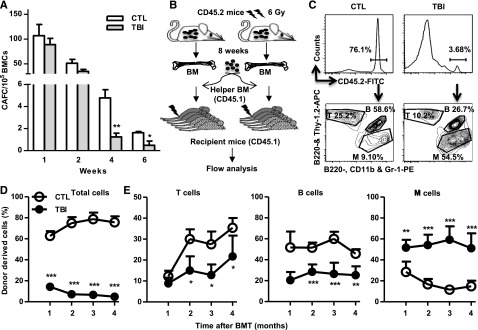
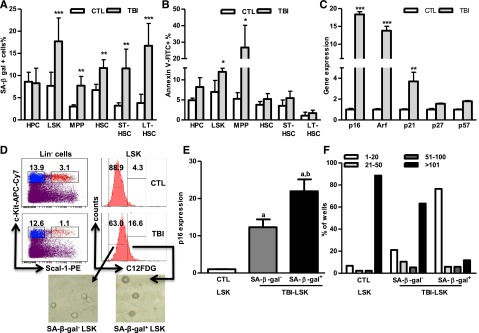
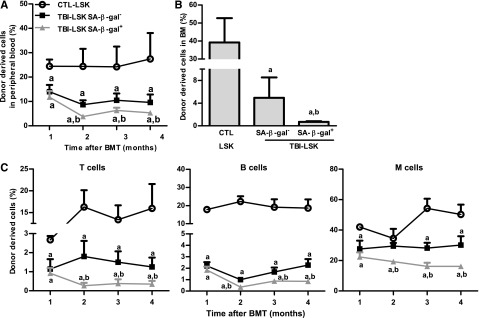
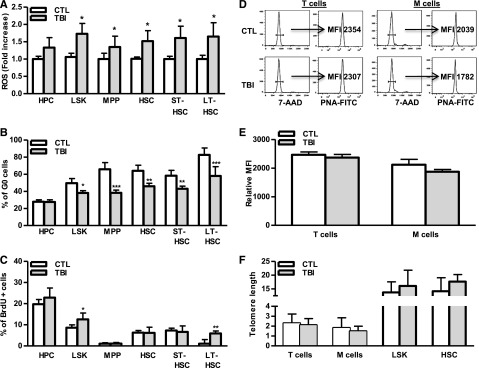
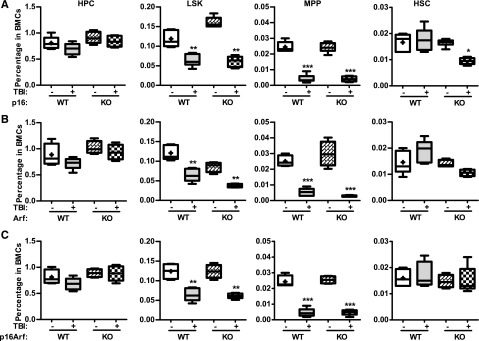
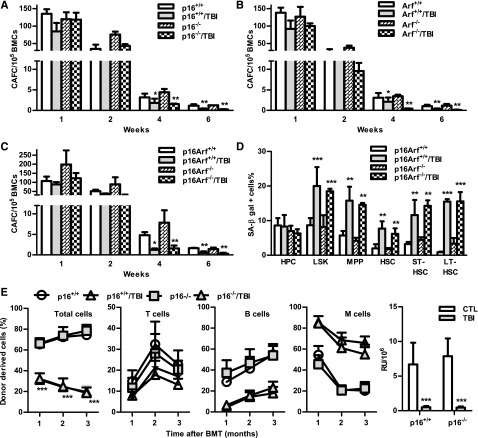
Exposure to total body irradiation (TBI) induces not only acute hematopoietic radiation syndrome but also long-term or residual bone marrow (BM) injury. This residual BM injury is mainly attributed to permanent damage to hematopoietic stem cells (HSCs), including impaired self-renewal, decreased long-term repopulating capacity, and myeloid skewing. These HSC defects were associated with significant increases in production of reactive oxygen species (ROS), expression of p16(Ink4a) (p16) and Arf mRNA, and senescence-associated β-galacotosidase (SA-β-gal) activity, but not with telomere shortening or increased apoptosis, suggesting that TBI induces residual BM injury via induction of HSC premature senescence. This suggestion is supported by the finding that SA-β-gal(+) HSC-enriched LSK cells showed more pronounced defects in clonogenic activity in vitro and long-term engraftment after transplantation than SA-β-gal(-) LSK cells isolated from irradiated mice. However, genetic deletion of p16 and/or Arf had no effect on TBI-induced residual BM suppression and HSC senescence, because HSCs from irradiated p16 and/or Arf knockout (KO) mice exhibited changes similar to those seen in HSCs from wild-type mice after exposure to TBI. These findings provide important new insights into the mechanism by which TBI causes long-term BM suppression (eg, via induction of premature senescence of HSCs in a p16-Arf-independent manner).


Figures

Figure 1
Figure 1
TBI causes sustained quantitative reduction of MPPs but not of HPCs and HSCs. C57BL/6 mice were exposed to a sublethal dose (6 Gy) of TBI or were sham irradiated as a control (CTL). Two months after TBI, BM cells (BMCs) were harvested from the 2 hind legs of individual mice for analysis. (A) Representative gating strategy of flow cytometric analysis for HPCs (LinSca1c-kit+ cells), LSK cells (LinSca1+c-kit+ cells), MPPs (CD150CD48LSK cells), HSCs (CD150+CD48LSK cells), ST-HSCs (CD34+CD150+CD48LSK cells), and LT-HSCs (CD34CD150+CD48LSK cells) in lineage-negative (Lin) BM-MNCs is shown. (B) Frequencies (upper panel) and total numbers (lower panel) of HPCs, LSK cells, MPPs, HSCs, ST-HSCs, and LT-HSCs in BMCs from each mouse are presented as mean ± SD (n = 6-8 mice/group). *P < .05, **P < .01, and ***P < .001, TBI vs CTL.
Figure 2
Figure 2
TBI causes sustained reduction of HSC clonogenic activity and long-term repopulating ability. (A) Two months after 6 Gy TBI, total BM cells (BMCs) were harvested from control (CTL) and irradiated (TBI) mice and were analyzed by CAFC assays. The numbers of 1-, 2-, 4-, and 6-week CAFCs were counted and expressed as mean ± SD (n = 3-4 mice per group) of CAFCs per 100 000 BMCs. *P < .05 and **P < .01, TBI vs CTL. (B) Diagram illustrating the competitive repopulating assay. (C) Representative gating strategy for flow cytometric analysis of CD45.2 donor cell engraftment with anti-CD45.2-FITC antibody. B cells were labeled with anti-B220-APC and B220-PE, T cells with anti-Thy1.2-APC, and myeloid (M) cells with anti-CD11b-PE and Gr-1-PE. (D) Percentages of total donor-derived (CD45.2) hematopoietic cells in peripheral blood of the recipients are presented as mean ± SD (CTL: n = 6; TBI: n = 8). ***P < .001, TBI vs CTL. (E) Percentages of T, B, and M cells in donor-derived hematopoietic cells in peripheral blood of the recipients are presented as mean ± SD (CTL: n = 6; TBI: n = 8). *P < .05, **P < .01, and ***P < .001, TBI vs CTL.
Figure 3
Figure 3
TBI induces senescence but not apoptosis in HSCs. BMCs were harvested from control (CTL) and irradiated (TBI) mice 2 months after 6 Gy TBI as described. (A-B) Percentages of SA-β-gal+ cells (A) and Annexin V–positive apoptotic cells (B) in HPCs, LSK cells, MPPs, HSCs, ST-HSCs, and LT-HSCs are presented as mean ± SD (CTL: n = 4; TBI: n = 6). *P < .05, **P < .01, and ***P < .001, TBI vs CTL. (C) Fold increases in relative gene expression for various CDK inhibitors in sorted HSCs after TBI. Data from 3 independent experiments using sorted HSCs pooled from 3 to 4 mice per group are presented as mean ± SD (n = 3). **P < .01 and ***P < .001, TBI vs CTL. (D) SA-β-gal+ and SA-β-gal LSK cells were isolated from irradiated mice (TBI) 2 months after 6 Gy TBI by cell sorting according to the intensity of C12FDG staining. Their differential SA-β-gal activities were confirmed by SA-β-gal enzymatic activity assay after isolation as shown in the inserted microscopic images. (E) The expression of p16 in SA-β-gal+ and SA-β-gal LSK cells and in control unirradiated LSK cells (CTL) was measured with qRT-PCR and expressed as fold increases compared with CTL. Data are presented as mean ± SD (n = 3). a, P < .05 vs CTL-LSK cells; b, P < .05 vs TBI-LSK β-gal cells. (F) Cumulative production of number of cells from wells with single TBI SA-β-gal+ and SA-β-gal LSK cells and control (CTL) LSK cells is shown as a representative of 3 separated assays.
Figure 4
Figure 4
SA-β-gal+ LSK cells from total body–irradiated mice are highly deficient in long-term engraftment after transplantation. Five hundred CD45.2 SA-β-gal+ or SA-β-gal LSK cells isolated from irradiated mice (TBI) or 500 control unirradiated LSK cells (CTL) along with 2 × 10⁵ competitive CD45.1 BM cells were transplanted into lethally irradiated CD45.1 recipient. (A) Percentages of total donor-derived cells in peripheral blood at various times after transplantation. (B) Percentage of donor cell engraftment in BM 4 months after transplantation. (C) Percentages of peripheral blood T-cell, B-cell, and myeloid (M) cell engraftment at various times after transplantation. The data are presented as mean ± SD (n = 6 recipients/group). a, P < .05 vs CTL-LSK cells; b, P < .05 vs TBI-LSK β-gal cells.
Figure 5
Figure 5
TBI causes persistent increases in ROS production and cell cycling in HSCs without induction of telomere shortening. BMCs were harvested from control (CTL) and irradiated (TBI) mice 2 months after 6 Gy TBI as described. (A) Fold increases in ROS production in BM HPCs, LSK cells, MPPs, HSCs, ST-HSCs, and LT-HSCs after TBI are presented as mean ± SD (CTL: n = 4 ; TBI: n = 6). *P < .05, TBI vs CTL. (B-C) Percentages of G0 (B) and BrdU-positive cells (C) in BM HPCs, LSK cells, MPPs, HSCs, ST-HSCs, and LT-HSCs from control (CTL) and irradiated (TBI) mice are presented as mean ± SD (CTL: n = 4 ; TBI: n = 6). *P < .05, **P < .01, and ***P < .001, TBI vs CTL. (D) Representative flow plots for telomere length measurement in T cells and myeloid cells (M cells) by flow FISH. (E) The relative telomere lengths of these cells from 3 independent experiments using sorted T and M cells pooled from 3 to 4 TBI or control (CTL) mice per group are presented as mean ± SD of relative MFI of telomere fluorescent staining. (F) Relative telomere lengths of HSCs, LSK cells, T cells, and myeloid cells (M cells) from control (CTL) and irradiated (TBI) mice analyzed by qPCR-based telomere length assays. Data from 3 independent experiments using sorted HSC, LSK cells, T cells, and M cells pooled from 3 to 4 mice per group are presented as mean ± SD of the ratios of telomere vs the 36B4 single-copy gene.
Figure 6
Figure 6
Knockout of p16 and/or Arf has no effect on TBI-induced reduction of MPPs. p16−/− (KO), Arf−/− (KO), p16Arf−/− (KO), and WT mice were exposed to a sublethal dose (6 Gy) of TBI or were sham irradiated as a control. Two months after TBI, BM cells (BMCs) harvested from the 2 hind legs of individual mice were analyzed by flow cytometry for HPCs, LSK cells, MPPs, and HSCs. The frequencies of HPCs, LSK cells, MPPs, and HSCs in BMCs from each mouse strain are presented as mean ± SD (CTL: n = 4; TBI: n = 6). *P < .05, **P < .01, and ***P < .001, TBI vs control unirradiated mice.
Figure 7
Figure 7
Knockout of p16 and/or Arf has no effect on TBI-induced HSC senescence and long-term injury. (A-C) Two months after 6 Gy TBI, total BM cells (BMCs) were harvested from control and irradiated (TBI) p16−/−, Arf−/−, and p16Arf−/− mice and p16+/+, Arf+/+, and p16Arf+/+ mice for clonogenic function analysis by CAFC assays. The numbers of 1-, 2-, 4-, and 6-week CAFCs were counted and expressed as mean ± SD (n = 3 mice/group) of CAFCs per 100 000 BMCs. *P < .05 and **P < .01, TBI vs CTL. (D) Two months after 6 Gy TBI, total BM cells (BMCs) were harvested from control and irradiated (TBI) p16Arf−/− and p16Arf+/+ mice for analyses of SA-β-gal activity in various populations of BM hematopoietic cells using C12FDG as a substrate. Percentages of SA-β-gal–positive cells in HPCs, LSK cells, MPPs, HSCs, ST-HSCs, and LT-HSCs are presented as mean ± SD (CTL: n = 3 and TBI: n = 4). **P < .01 and ***P < .001, TBI vs CTL. (E) Two months after 6 Gy TBI, total BM cells (BMCs) were harvested from control and irradiated (TBI) p16−/− and p16+/+ mice for analysis of HSC long-term repopulating ability by CRA as described in Figure 2B. Percentages of total donor-derived (CD45.2) hematopoietic cells in peripheral blood of the recipients and percentages of T cells, B cells, and myeloid (M) cells in donor-derived hematopoietic cells in the peripheral blood of recipients are presented as mean ± SD (n = 9-10 recipients from 2 independent experiments). ***P < .001, TBI vs CTL. (F) Repopulating units (RU) calculated according to the engraftment data presented in (E) are presented as mean ± SD. ***P < .001, TBI vs CTL.

Comment in

  • HSC senescence upon irradiation.
    Geiger H. Geiger H. Blood. 2014 May 15;123(20):3060-1. doi: 10.1182/blood-2014-03-563718. Blood. 2014. PMID: 24832936 Free PMC article.

References

    1. Mauch P, Constine L, Greenberger J, et al. Hematopoietic stem cell compartment: acute and late effects of radiation therapy and chemotherapy. Int J Radiat Oncol Biol Phys. 1995;31(5):1319–1339. - PubMed
    1. Testa NG, Hendry JH, Molineux G. Long-term bone marrow damage in experimental systems and in patients after radiation or chemotherapy. Anticancer Res. 1985;5(1):101–110. - PubMed
    1. Mohrin M, Bourke E, Alexander D, et al. Hematopoietic stem cell quiescence promotes error-prone DNA repair and mutagenesis. Cell Stem Cell. 2010;7(2):174–185. - PMC - PubMed
    1. Gardner RV, Begue R, McKinnon E. The effect of granulocyte-macrophage colony-stimulating factor (GM-CSF) on primitive hematopoietic stem cell (PHSC) function and numbers, after chemotherapy. Exp Hematol. 2001;29(9):1053–1059. - PubMed
    1. van Os R, Robinson S, Sheridan T, Mislow JM, Dawes D, Mauch PM. Granulocyte colony-stimulating factor enhances bone marrow stem cell damage caused by repeated administration of cytotoxic agents. Blood. 1998;92(6):1950–1956. - PubMed

Publication types

MeSH terms

Substances