. 2014 Mar 12;4(5):839-50.
doi: 10.1534/g3.114.010652.

Coordinated metabolic transitions during Drosophila embryogenesis and the onset of aerobic glycolysis

Affiliations

Coordinated metabolic transitions during Drosophila embryogenesis and the onset of aerobic glycolysis

Jason M Tennessen et al. G3 (Bethesda). .

Abstract

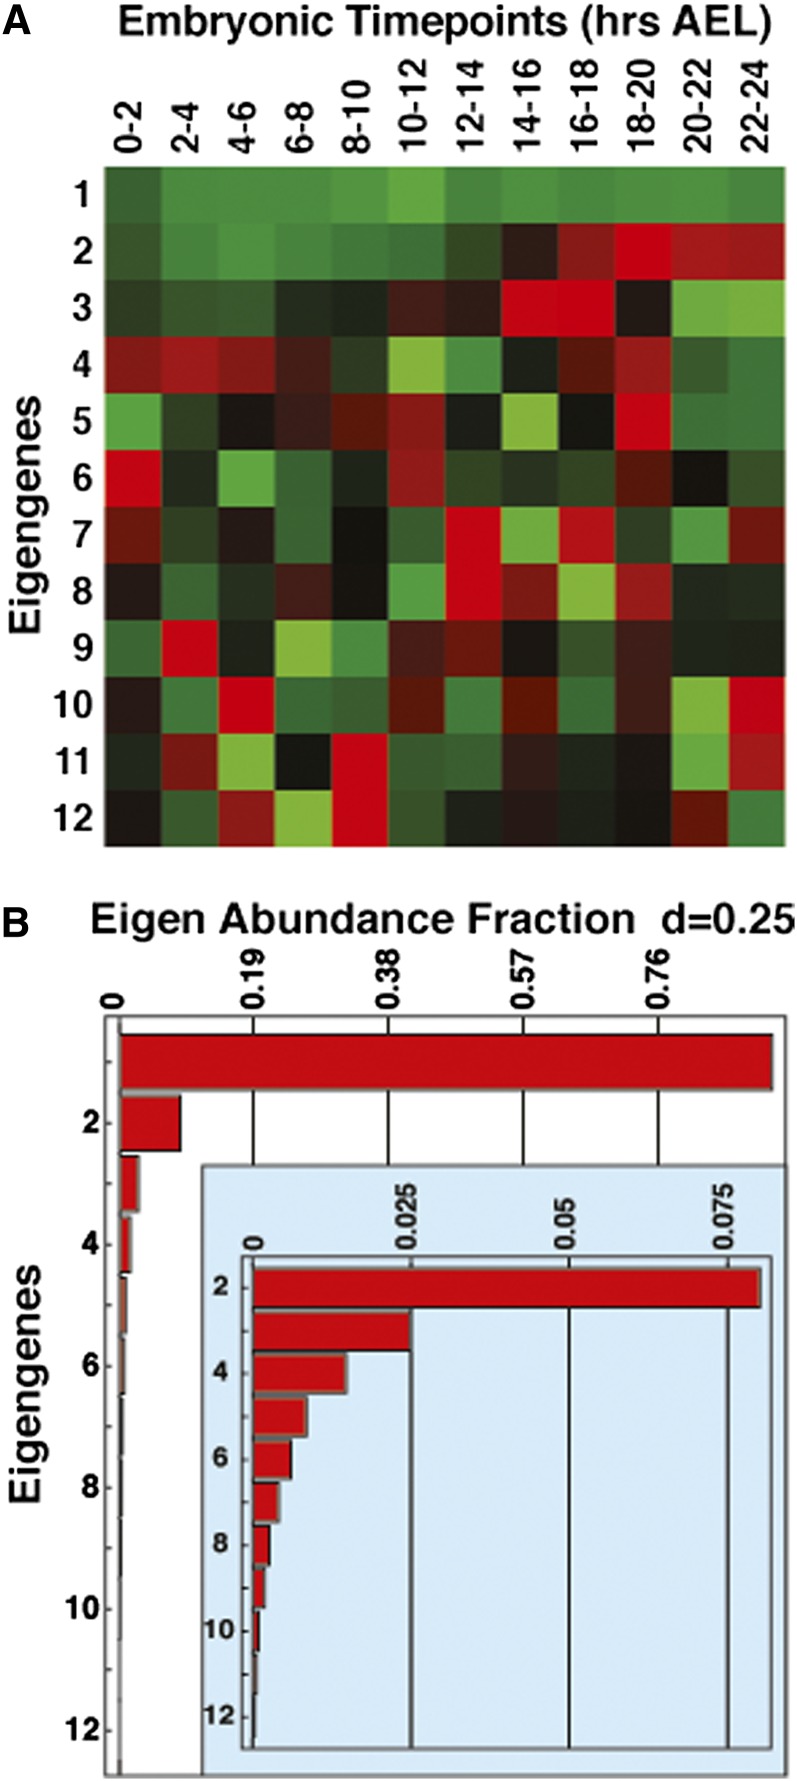
Rapidly proliferating cells such as cancer cells and embryonic stem cells rely on a specialized metabolic program known as aerobic glycolysis, which supports biomass production from carbohydrates. The fruit fly Drosophila melanogaster also utilizes aerobic glycolysis to support the rapid growth that occurs during larval development. Here we use singular value decomposition analysis of modENCODE RNA-seq data combined with GC-MS-based metabolomic analysis to analyze the changes in gene expression and metabolism that occur during Drosophila embryogenesis, spanning the onset of aerobic glycolysis. Unexpectedly, we find that the most common pattern of co-expressed genes in embryos includes the global switch to glycolytic gene expression that occurs midway through embryogenesis. In contrast to the canonical aerobic glycolytic pathway, however, which is accompanied by reduced mitochondrial oxidative metabolism, the expression of genes involved in the tricarboxylic cycle (TCA cycle) and the electron transport chain are also upregulated at this time. Mitochondrial activity, however, appears to be attenuated, as embryos exhibit a block in the TCA cycle that results in elevated levels of citrate, isocitrate, and α-ketoglutarate. We also find that genes involved in lipid breakdown and β-oxidation are upregulated prior to the transcriptional initiation of glycolysis, but are downregulated before the onset of larval development, revealing coordinated use of lipids and carbohydrates during development. These observations demonstrate the efficient use of nutrient stores to support embryonic development, define sequential metabolic transitions during this stage, and demonstrate striking similarities between the metabolic state of late-stage fly embryos and tumor cells.

Keywords: aerobic glycolysis; embryogenesis; metabolism; metabolomics.


Figures

Figure 1
Figure 1
Statistical analysis of embryonic gene expression using SVD. Embryonic RNA-seq time course data from the Drosophila modENCODE project were analyzed using SVD, revealing (A) 12 eigengene expression patterns in matrix VT. (B) A bar graph depicts the eigenexpression fractions demonstrating that the top three patterns account for 96% of the overall expression in embryos. Consistent with this observation, the data possess a low Shannon entropy (d = 0.25), indicating that the majority of the data are characterized by a subset of these patterns.
Figure 2
Figure 2
Transcriptional profiles of metabolic genes identified by SVD analysis. Total RNA from staged w1118 embryos were analyzed by northern blot hybridization to detect transcripts encoding components of (A) the TCA cycle and ETC or (B) fatty acid β-oxidation. A transfer artifact makes the CPTI signal at 20 to 22 hr appear lower than it is; it should appear similar to the signal in the flanking lanes. Hybridization to detect rp49 mRNA is included as a loading control.
Figure 3
Figure 3
Stored lipids and carbohydrates are depleted during CanS embryogenesis. Triacylglycerol (TAG) (A), glycogen (B), and soluble protein (C) levels were measured at 4-hr intervals during the course of embryogenesis. Both glycogen and TAG exhibit a significant decrease as development progresses, whereas soluble protein levels increase. Each bar represents the mean value of n = 6 samples containing 300 staged and hand-sorted CanS embryos. Data were normalized to the mean value of the 0- to 2-hr time point. P < 0.05, Student t-test). Error bars represent ± SEM.
Figure 4
Figure 4
Metabolomic analysis of glycolysis in w1118 embryos. Small-molecule GC-MS was used to analyze the relative abundance of metabolites related to glycolysis. (A) Although glucose-6-phosphate concentrations exhibited significant fluctuation, the median value remained nearly constant throughout embryogenesis. (B, C) Both pyruvate and lactate levels increase gradually as embryogenesis progresses, although these changes are not significant. (D) Embryos exhibit a nearly 10-fold increase in glycerol-3-phosphate levels. All data are graphically represented as a box plot, with the box representing the first and third quartiles, the median represented as the horizontal line within the box, and the bars representing the maximum and minimum points. Values are relative to the median of the 0- to 2-hr sample, which was normalized to 100; n > 6 independent samples for each time point. Each sample contains 300 staged and hand-sorted embryos. *P < 0.01 compared with the 0- to 2-hr AEL time point.
Figure 5
Figure 5
Metabolomic analysis of TCA cycle intermediates in w1118 embryos. Small-molecule GC-MS was used to analyze the relative abundance of TCA cycle intermediates. (A–C) Citrate, isocitrate, and α-ketoglutarate levels significantly increase during the course of embryogenesis. In contrast, the concentration of succinate (D) approximately doubles during this time course, whereas fumarate (E) and malate (F) levels remain relatively stable. All data are graphically represented as described in Figure 4. *P < 0.01 compared with the 0- to 2-hr AEL time point.
Figure 6
Figure 6
Changes in w1118 embryonic amino acid pools. Small-molecule GC-MS was used to analyze changes in amino acid levels at 2-hr intervals throughout the course of w1118 embryogenesis. The essential amino acid methionine (A) as well as glucogenic amino acid serine (B) and the ketogenic amino acid glutamine (C) exhibit only minor fluctuations during the course of embryogenesis. The abundance of glutamate (D) increases during the beginning of embryogenesis, but then gradually declines until just prior to hatching. In contrast, proline (E) decreases during early embryogenesis and then increases approximately two-fold compared with the initial concentration. (F) Aspartate undergoes a consistent and dramatic decrease throughout the course of embryogenesis. All data are graphically represented as described in Figure 4. *P < 0.01 compared with the 0- to 2-hr AEL time point. Black diamonds (♦) represent the relative amino acid concentrations reported by Crone-Gloor (1959).
Figure 7
Figure 7
Analysis of metabolites associated with amino acid and purine degradation in w1118 embryos. Small-molecule GC-MS was used to analyze the relative abundance of compounds associated with amino acid and purine degradation at 2-hr intervals throughout the course of w1118 embryogenesis. Although the levels of urea (A) remain stable throughout embryogenesis, uric acid levels (B) exhibit the most dramatic increase of any metabolite in our analysis. (C) β-alanine levels decline sharply 2 to 4 hr AEL and then gradually increase during the course of embryogenesis. (D) The relative concentration of kynurenine remains stable for the first 12 hr of embryogenesis but then undergoes a dramatic decrease that correlates with the onset of the EmbMT. All data are graphically represented as described in Figure 4. *P < 0.01 compared with the 0- to 2-hr AEL time point.
Figure 8
Figure 8
Summary of embryonic metabolism. (A) The coordinate upregulation of glycolysis during the EmbMT corresponds with the elevated expression of genes associated with the TCA cycle and ETC. (B) The expression of these genes correlate with the depletion of glycogen and the build-up of key metabolic intermediates, including citrate, isocitrate, α-ketoglutarate, and glycerol-3-phosphate. (A) LDH expression begins slightly earlier than other genes associated with the EmbMT. (B) Although levels of lactate and pyruvate appear to increase during embryogenesis, this is diet-dependent (*), and these levels remain largely unchanged when the maternal diet is mostly yeast-based. A pulse (A) of β-oxidation during mid embryogenesis corresponds with a decrease in (B) TAG levels.

References

    1. Alter O., 2006. Discovery of principles of nature from mathematical modeling of DNA microarray data. Proc. Natl. Acad. Sci. USA 103: 16063–16064 - PMC - PubMed
    1. Alter O., Brown P. O., Botstein D., 2000. Singular value decomposition for genome-wide expression data processing and modeling. Proc. Natl. Acad. Sci. USA 97: 10101–10106 - PMC - PubMed
    1. Alter O., Golub G. H., 2004. Integrative analysis of genome-scale data by using pseudoinverse projection predicts novel correlation between DNA replication and RNA transcription. Proc. Natl. Acad. Sci. USA 101: 16577–16582 - PMC - PubMed
    1. Alter O., Golub G. H., 2006. Singular value decomposition of genome-scale mRNA lengths distribution reveals asymmetry in RNA gel electrophoresis band broadening. Proc. Natl. Acad. Sci. USA 103: 11828–11833 - PMC - PubMed
    1. Backhaus B., Sulkowski E., Schlote F., 1984. A semi-synthetic, general-purpose medium for Drosophila melanogaster Drosophila Information Service. 60: 210–212.

Publication types

MeSH terms

LinkOut - more resources