. 2015 Mar;220(2):677-702.
doi: 10.1007/s00429-014-0717-9. Epub 2014 Mar 13.

A mu-delta opioid receptor brain atlas reveals neuronal co-occurrence in subcortical networks

Affiliations

A mu-delta opioid receptor brain atlas reveals neuronal co-occurrence in subcortical networks

Eric Erbs et al. Brain Struct Funct. 2015 Mar.

Abstract

Opioid receptors are G protein-coupled receptors (GPCRs) that modulate brain function at all levels of neural integration, including autonomic, sensory, emotional and cognitive processing. Mu (MOR) and delta (DOR) opioid receptors functionally interact in vivo, but whether interactions occur at circuitry, cellular or molecular levels remains unsolved. To challenge the hypothesis of MOR/DOR heteromerization in the brain, we generated redMOR/greenDOR double knock-in mice and report dual receptor mapping throughout the nervous system. Data are organized as an interactive database offering an opioid receptor atlas with concomitant MOR/DOR visualization at subcellular resolution, accessible online. We also provide co-immunoprecipitation-based evidence for receptor heteromerization in these mice. In the forebrain, MOR and DOR are mainly detected in separate neurons, suggesting system-level interactions in high-order processing. In contrast, neuronal co-localization is detected in subcortical networks essential for survival involved in eating and sexual behaviors or perception and response to aversive stimuli. In addition, potential MOR/DOR intracellular interactions within the nociceptive pathway offer novel therapeutic perspectives.


Figures
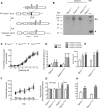
Fig. 1
Fig. 1
Expression of functional receptors in MOR-mcherry knock-in mice. a Targeting strategy: Oprm1 exons, mcherry cDNA, and the FRT (triangle) flanked neomycin cassette are, respectively, displayed as exon number, mcherry, and neo. Homologous recombination (HR) was followed by FLP recombinase treatment (FLP) in ES cells. Positions of the oligonucleotides (BAZ 43, BAZ 44) used for genotyping are indicated. b Western blot: detection of MOR-mcherry fusion by immunoblotting with antibodies directed against mcherry on membranes from striatum and periaqueductal gray (PAG) from wild-type (Oprm1 +/+), heterozygote (Oprm1 +/mch) and homozygote (Oprm1 mch/mch) mice (MOR-mcherry fusion indicated by arrow). Cos cells transfected with a plasmid encoding mcherry (cos) were added as a control for unbound mcherry protein detection with the anti-mcherry antibody (arrow head). c G protein activation: similar [35S] GTPγS incorporation was measured on brain membranes from wild-type (filled square) (n = 8), heterozygous (n = 7) (filled diamond) and homozygous (n = 11) (filled circle) mice following stimulation with the mu-selective agonist DAMGO. Data are the mean ± sem from independent experiments performed in triplicate (n = 3 animals per genotype). d Tail immersion test: similar tail withdrawal latencies were measured at 52 °C in wild-type (Oprm1 +/+) and MOR-mcherry (Oprm1 mch/mch) mice after saline or morphine injection (5 or 10 mg/kg, i.p.). Data are presented as mean ± sem (n = 16 animals/group). *p < 0.05, ***p < 0.001 morphine effect compared to baseline. e Hot plate test: similar jump latencies from a hot plate at 52 °C were measured in wild-type (Oprm1 +/+) and MOR-mcherry (Oprm1 mch/mch) mice after saline or morphine injection (5 or 10 mg/kg, i.p.). Data are presented as mean ± sem (n = 16 animals/group). *p < 0.05, **p < 0.01, ***p < 0.001 morphine effect compared to baseline. f Locomotor sensitization: wild-type (Oprm1 +/+) or MOR-mcherry (Oprm1 mch/mch) mice received daily morphine (25 mg/kg, i.p.) or saline injections for 5 days. Similar locomotor activities were recorded for 1 h. Data are expressed as total traveled distance (mean ± sem) (n = 8–10 animals/group). g Conditioned place preference: wild-type (Oprm1 +/+) or MOR-mcherry (Oprm1 mch/mch) mice showed similar preference for the compartment associated with morphine (10 mg/kg, s.c.) following three conditioning sessions. Place preference corresponds to the time spent in the drug-paired compartment expressed as a percentage of time spent in the two compartments during the 20 min pre- and post-test conditioning sessions (n = 8 animals/group). Data are presented as mean ± sem. Treatment effect ***p < 0.001. h Physical dependence: global scores of pharmacological withdrawal precipitated by naloxone (1 mg/kg, s.c.) were similar in wild-type (Oprm1 +/+) or MOR-mcherry (Oprm1 mch/mch) mice treated with escalating doses of morphine (20, 40, 60, 80, 100 mg/kg) or in saline-treated controls (n = 8/group). Data are presented as mean ± sem. Drug effect ***p < 0.001
Fig. 2
Fig. 2
MOR-mcherry subcellular localization and trafficking. a The in vivo fluorescent signal associated to MOR-mcherry is located at the surface of the neuron (white arrow) and intracellularly. b In vivo localization of MOR-mcherry at the plasma membrane (white arrow) upon detection with an anti-mcherry receptor antibody revealed with an AlexaFluor 594-coupled secondary antibody (top) or upon detection with an anti-mu receptor antibody revealed with an AlexaFluor 488-coupled secondary antibody (bottom). c MOR-mcherry subcellular localization in primary hippocampal neurons fixed at various time points after stimulation with the MOR-selective agonist DAMGO 1 μM. Scale bars 10 μm
Fig. 3
Fig. 3
Distribution of mu and delta opioid receptors in the nervous system. a Brain distribution of the MOR-mcherry construct. The size of the red circle is indicative of the abundance of the receptor in the given area. A pink circle indicates low expression level. b Brain distribution of the DOR-eGFP construct. The size of the green circle is indicative of the abundance of the receptor in the given area. A pale green circle indicates low expression level. See list for abbreviations
Fig. 4
Fig. 4
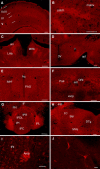
Brain mapping of MOR-mcherry expression at cellular resolution MOR-mcherry expression is observed in discrete neuronal populations at the level of the a cortex, b striatum, c habenula, d lateral hypothalamus, e periaqueductal gray matter, f paratrochlear nucleus, g interpeduncular nucleus, h locus coeruleus area, i nucleus ambiguus, j detail of the lateral hypothalamus. Scale bars 200 and 20 μm (j)
Fig. 5
Fig. 5
MOR/DOR neurons in the nervous system. a Brain mapping of neurons co-expressing MOR-mcherry and DOR-eGFP under basal conditions (orange filled circle) or following treatment with the DOR agonist SNC 80 (10 mg/kg, s.c. for 2 h) (yellow filled circle). See list for abbreviations. b Co-localization of MOR-mcherry and DOR-eGFP within the same neuron in dorsal root ganglia (DRG) (white arrow), oriens (or) and pyramidal (pyr) layers of the hippocampus, lateral hypothalamus (LH), basal nucleus of Meynert (B), piriform cortex (pir). Scale bars 10 μm
Fig. 6
Fig. 6
MOR and DOR neuronal co-expression in dorsal root ganglia and spinal cord. a In dorsal root ganglia, MOR-mcherry and DOR-eGFP are co-expressed under basal conditions in small- and medium-size neurons in addition to large neurons (shown in Fig. 5b) (arrows). Scale bars 20 μm. b Neurons co-expressing MOR-mcherry and DOR-eGFP are visualized in the different layers of the spinal cord following treatment with the delta agonist SNC 80 (10 mg/kg, s.c., 2 h). General view (top panel) and individual neurons (bottom panel). Scale bars 10 μm
Fig. 7
Fig. 7
Fine mapping of MOR/DOR neurons in the hippocampus. a Neurons co-expressing MOR-mcherry and DOR-eGFP are identified by co-localization with the neuronal markers calbindin, parvalbumin or somatostatin. Scale bars 10 μm. b MOR and DOR form heteromers in the hippocampus. Immunoprecipitation with rabbit polyclonal anti-mcherry antibodies was performed on solubilized membranes from the cortex (cx) or hippocampus (hippo). Western blotting of the isolated immunocomplexes using rabbit polyclonal anti eGFP antibodies detected the DOR-eGFP construct (arrow) in the hippocampus where MOR-mcherry and DOR-eGFP co-localize
Fig. 8
Fig. 8
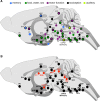
MOR/DOR neurons concentrate in networks essential for survival. a MOR/DOR co-expressing neurons are detected in pathways essential for survival. Areas belonging to pathways classically related to memory (filled blue circle), sex and food and water consumption (filled dark green), motor function (filled purple circle), nociception (filled black circle) and audition (filled light green circle) are indicated. Regions belonging to two networks are presented as a two-color circle. b In addition to MOR/DOR-containing neurons (filled black circle), brain regions activated by painful stimuli also included neurons expressing MOR only (filled red circle) See list for abbreviations

References

    1. Arttamangkul S, Quillinan N, Low MJ, von Zastrow M, Pintar J, Williams JT. Differential activation and trafficking of micro-opioid receptors in brain slices. Mol Pharmacol. 2008;74(4):972–979. doi: 10.1124/mol.108.048512. - DOI - PMC - PubMed
    1. Aston-Jones G, Smith RJ, Moorman DE, Richardson KA. Role of lateral hypothalamic orexin neurons in reward processing and addiction. Neuropharmacology. 2009;56(Suppl 1):112–121. doi: 10.1016/j.neuropharm.2008.06.060. - DOI - PMC - PubMed
    1. Basbaum AI, Bautista DM, Scherrer G, Julius D. Cellular and molecular mechanisms of pain. Cell. 2009;139(2):267–284. doi: 10.1016/j.cell.2009.09.028. - DOI - PMC - PubMed
    1. Befort K, Filliol D, Decaillot FM, Gaveriaux-Ruff C, Hoehe MR, Kieffer BL. A single nucleotide polymorphic mutation in the human mu-opioid receptor severely impairs receptor signaling. J Biol Chem. 2001;276(5):3130–3137. doi: 10.1074/jbc.M006352200. - DOI - PubMed
    1. Befort K, Filliol D, Ghate A, Darcq E, Matifas A, Muller J et al (2008) Mu-opioid receptor activation induces transcriptional plasticity in the central extended amygdala. Eur J Neurosci 27(11):2973–2984 - PubMed

Publication types

Substances