. 2014 Jun;88(11):6031-46.
doi: 10.1128/JVI.00449-14. Epub 2014 Mar 12.

HIV-1 Vpu antagonism of tetherin inhibits antibody-dependent cellular cytotoxic responses by natural killer cells

Affiliations

HIV-1 Vpu antagonism of tetherin inhibits antibody-dependent cellular cytotoxic responses by natural killer cells

Raymond A Alvarez et al. J Virol. 2014 Jun.

Abstract

The type I interferon-inducible factor tetherin retains virus particles on the surfaces of cells infected with vpu-deficient human immunodeficiency virus type 1 (HIV-1). While this mechanism inhibits cell-free viral spread, the immunological implications of tethered virus have not been investigated. We found that surface tetherin expression increased the antibody opsonization of vpu-deficient HIV-infected cells. The absence of Vpu also stimulated NK cell-activating FcγRIIIa signaling and enhanced NK cell degranulation and NK cell-mediated antibody-dependent cellular cytotoxicity (ADCC). The deletion of vpu in HIV-1-infected primary CD4(+) T cells enhanced the levels of antibody binding and Fc receptor signaling mediated by HIV-positive-patient-derived antibodies. The magnitudes of antibody binding and Fc signaling were both highly correlated to the levels of tetherin on the surfaces of infected primary CD4 T cells. The affinity of antibody binding to FcγRIIIa was also found to be critical in mediating efficient Fc activation. These studies implicate Vpu antagonism of tetherin as an ADCC evasion mechanism that prevents antibody-mediated clearance of virally infected cells.

Importance: The ability of the HIV-1 accessory factor to antagonize tetherin has been considered to primarily function by limiting the spread of virus by preventing the release of cell-free virus. This study supports the hypothesis that a major function of Vpu is to decrease the recognition of infected cells by anti-HIV antibodies at the cell surface, thereby reducing recognition by antibody-dependent clearance by natural killer cells.


Figures
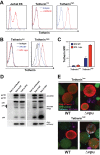
FIG 1
FIG 1
Tetherin CD4+ T cell model system. (A) Heterogeneous expression of surface tetherin on unsorted CD4+ Jurkat E6 cells (left). The Jurkat E6 cells were stained for tetherin expression (red line) and then flow sorted into tetherinlow (center) and tetherinhigh (right) populations, which remained stable in culture. (B) Tetherinlow and tetherinhigh cells were infected with WT (blue line) or Δvpu (red line) mCherry fluorescent protein-expressing HIV-1, and surface tetherin on the mCherry-positive infected cells was assessed by flow cytometry. The histogram plots show the modulation of surface tetherin on the HIV-infected tetherinlow (left) and tetherinhigh (right) cells 48 h after infection. (C) Mean fluorescence intensity (MFI) of surface tetherin in HIV-infected tetherinlow and tetherinhigh cells. (D) Western blot showing the levels of HIV-1 protein expression in the tetherinlow and tetherinhigh cells infected with WT or Δvpu HIV-1. Samples were normalized to 20% infection, as indicated by mCherry expression. Cellular lysates were probed with polyclonal anti-HIV antisera, an anti-HIV Env, and an anti-mCherry antibody. (E) Tetherinlow and tetherinhigh cells (GFP+) were infected with WT and Δvpu HIV-1 (mCherry+) for 48 h, and the surface tetherin (cyan) localization was assessed by spinning disk confocal microscopy. Maximum intensity projections are displayed.
FIG 2
FIG 2
High tetherin expression correlates with anti-HIV antibody binding on HIV-infected lymphocytes. Tetherinlow and tetherinhigh cells were infected with WT or Δvpu HIV-1, and the levels of surface antibody binding on HIV-infected cells were assessed by using a panel of broadly neutralizing anti-HIV antibodies or polyclonal patient sera. (A) Surface binding of anti-Env neutralizing antibodies b12, 2G12, and 4E10 and polyclonal anti-HIV IgG sera, as measured by flow cytometry. The percentages of HIV-infected cells binding antibody are shown in boldface. (B) Mean percentages of Env-positive cells from five biological replicates. (C) The mean fluorescence of the Env-positive cells was plotted (average of five independent experiments). (D) The fluorescence index was calculated by multiplying the percentage of infected cells by the MFI index. The graph shows the fluorescent index values of anti-HIV antibody binding to the surfaces of tetherinhigh and tetherinlow HIV-1-infected populations. The levels of antibody binding in panels B to D were calculated from five independent staining experiments.
FIG 3
FIG 3
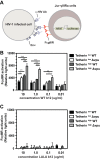
Tetherin surface expression increases FcγRIIIa stimulation. (A) Diagram depicting the FcγRIIIa assay. A Jurkat E6-derived indicator cell line expresses FcγRIIIa. Upon FcγRIIIa stimulation, activation of the NFAT transcription factor induces luciferase expression. Tetherinlow and tetherinhigh cells were infected with WT or Δvpu HIV-1 for 48 h and normalized to 15 to 20% infection, as indicated by mCherry expression. Infected populations were then cocultured in the presence or absence of either the WT b12 antibody (B) or a LALA b12 antibody with an altered Fc region that abrogates FcγRIIIa stimulation (C). These populations were cocultured at a 5:1 ratio of FcγRIIIa-expressing effector to HIV-infected target cells for 16 h. After 16 h, the luciferase activity in the lysed cells indicates FcγRIIIa activation. The graphs show the means of results of three independent experiments conducted in duplicate. *, P < 0.05; **, P, < 0.01; ***, P < 0.001.
FIG 4
FIG 4
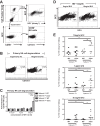
Tetherin surface expression increases primary NK cell degranulation and ADCC killing. Tetherinlow and tetherinhigh cells infected with either WT or Δvpu HIV-1 were cocultured with primary CD56+ CD3 NK cells at a 1:10 ratio of infected target to NK cells in the presence or absence of different concentrations of the b12 antibody. (A) Gating scheme of the assays uses CellTracker violet staining to discriminate HIV-infected target cells (Violet+) from NK cells (upper left panel). To assess the activation of NK cells, we measured surface CD107a in CD56+ cells (bottom panels). To assess infected cell killing, we measured the loss of HIV-infected cells (mCherry+) from the violet cells (upper right panel). (B) NK cell activation was measured after coculture with the HIV-infected CD4+ cells for 2 h in the presence or absence of b12 antibody. The levels of CD107a degranulation on NK cells indicate activation. (C) Graph representing the fold change in CD107a expression on the surfaces of NK cells in response to HIV-infected tetherinlow and tetherinhigh cells. The fold difference was calculated by dividing the levels of CD107a degranulation in the presence of b12 by those observed in the absence of antibody. (D) A primary NK ADCC assay was conducted in which NK cells were cocultured with HIV-infected tetherinhigh or tetherinlow cells for 6 h. The levels of specific killing within each HIV-infected population were assessed by flow cytometry. Dot plots depict the levels of NK cell-mediated ADCC in the absence of b12 (left panel) or in the presence of 10 μg of b12/ml (right panel). (E) Graphs represent the percentages of NK cell-mediated killing of tetherinlow and tetherinhigh cells infected with WT or Δvpu HIV after exposure to 0.1, 1, or 10 μg of b12 antibody/ml. The primary NK cells used in these assays were derived from four or five different donors. Each dot on the scatter plot represents the mean of technical replicates from each donor. *, P < 0.05; **, P < 0.01.
FIG 5
FIG 5
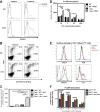
Impact of tetherin overexpression or mutation of a residue in Vpu required for tetherin downmodulation on infected-cell opsonization and FcγRIIIa signaling. (A) Tetherinlow cells transfected with the tetherin expression construct IRAT show higher levels of tetherin staining. Cells were stained with 5 μg of anti-tetherin APC antibody/ml. Histogram flow cytometry plots depict the level of tetherin in the tetherinlow cells that were nucleofected with WT HIV-1 (upper left), WT HIV-1 plus IRAT (upper right), Δvpu HIV-1 (lower left), or Δvpu HIV-1 plus IRAT (lower right). (B) Dot plots show the levels of surface b12 antibody binding to the surfaces of tetherinlow cells nucleofected with WT HIV-1 (upper left), WT HIV-1 plus IRAT (upper right), Δvpu HIV-1 (lower left), or Δvpu HIV-1 or IRAT (lower right). (C) The nucleofected populations were cocultured at a 5:1 ratio of Jur-γRIIIa effector cells to infected target cells for 16 h. After coculture, the total samples were lysed, and the levels of luciferase activity were measured. The graph depicts the relative light units produced by FcγIIIR-expressing cells in response to HIV-infected and b12-opsonized CD4+ populations. (D) The levels of surface NTB-A, PVR and tetherin expression, along with the levels of b12 binding to tetherinhigh cells infected with WT, Δvpu, or vpu(A14L) HIV-1 were assessed using surface antibody staining, followed by flow cytometry. Human anti-NTB-A, anti-PVR, and anti-tetherin antibodies were used at 5 μg/ml. (E) Graph showing the levels of FcγRIIIa stimulation in response to WT, Δvpu, or vpu(A14L) HIV-infected tetherinhigh cells. The data are from a representative experiment performed in triplicate. *, P < 0.05; **, P < 0.01; ***, P < 0.001.
FIG 6
FIG 6
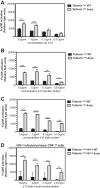
The magnitude of tetherin-enhanced FcγRIIIa stimulation is modulated by changes in antibody Fc regions that affect FcγRIIIa binding. Tetherinhigh CD4+ cells were infected with WT or Δvpu HIV-1 and 48 h later normalized to 20% infection. The infected populations were then incubated in the presence of WT b12 or b12 double (S239D/I332E) or triple (S239D/I332E/A330L) Fc mutants that confer enhanced binding and signaling through the FcγRIIIa (A to C). Graphs depict the levels of FcγRIIIa signaling in response to tetherinhigh cells infected with WT or Δvpu HIV incubated with a titration of either WT b12 (A) b12 double-mutant (B), or b12 triple-mutant (C) antibodies. (D) Primary CD4+ T cells were activated for 3 days and then infected with WT or Δvpu HIV-1. At 4 days after infection, the populations were normalized to 10% infection and cocultured with the Jur-γRIIIa cells at a 5:1 effector/target ratio for 16 h. The graph depicts the results from a representative experiment showing the levels of FcγIIIR stimulation in response to primary CD4+ lymphocytes cultured with either WT or Δvpu HIV-1. The data are of representative experiments conducted in triplicate.
FIG 7
FIG 7
Higher tetherin surface expression correlates with enhanced HIV-positive-patient-derived IgG opsonization of HIV-infected T cells and enhanced Fc receptor stimulation. Tetherinlow and tetherinhigh cells were infected WT or Δvpu HIV-1, and the levels of antibody binding were quantified by using purified polyclonal IgG antibodies derived from two HIV-negative and three HIV-positive donors. (A) Overlapping histograms show the levels of donor-derived IgG surface binding, as measured by flow cytometry in tetherinlow and tetherinhigh cells that were infected with WT or Δvpu HIV-1. (B) Graphs depicting the levels of FcγRIIIa signaling in response to tetherinlow and tetherinhigh cells infected with WT or Δvpu HIV-1 and incubated with a titration of different HIV-negative (left) or HIV-positive (right) donor-derived IgGs.
FIG 8
FIG 8
Tetherin surface expression correlates with enhanced HIV-positive-patient-derived IgG opsonization of HIV-infected T cells and enhanced Fc receptor stimulation in primary CD4+ T cells. (A) Primary CD4+ T cells isolated from three HIV-negative donors (D3890, D8800, and D7300) were activated for 2 days and infected with WT or Δvpu HIV-1. Two days after infection, the populations were normalized to 20% infection, and the levels of surface IgG binding were assessed. Overlapping histograms indicate the levels of surface IgG bound to primary CD4+ T cells infected with WT or Δvpu HIV-1 and incubated with a titration of different HIV-negative (left)- and HIV-positive (right)-donor-derived IgGs. (B) Graphs illustrate the correlation between the levels of antibody binding and the levels of tetherin surface expression in WT or Δvpu HIV-1-infected cells that were incubated with the HIV-positive-donor-derived IgG. The Spearman correlation was calculated, and a linear regression curve was plotted showing the r and P values for each graph. (C) Panels depict the levels of FcγRIIIa stimulation in primary CD4+ T cells infected with WT or Δvpu HIV-1 and incubated with a titration of HIV-positive-donor-derived IgGs from three different donors. Asterisks mark individual donors that yielded statistically significant differences between signaling stimulated by WT HIV-1 (open symbols)- and Δvpu HIV-1 (open symbols)-infected cells. (D) Cells from three different HIV-negative donor cells were treated with HIV-positive-patient-derived IgGs from three different patients, following infection with WT or Δvpu HIV-1. The enhancement of Fc receptor activation in the absence of Vpu is measured by the Wilcoxon matched-pair test at each concentration of antibody tested. (E) Panels show the positive correlation between the levels of FcγRIIIa signaling and the levels of tetherin surface expression on HIV-1-infected primary CD4+ T cells. WT and Δvpu HIV-infected cells are intermixed in the graph, showing a strong positive correlation between surface tetherin levels and Fc receptor signaling at 10, 1, or 0.1 μg of patient IgG/ml. A linear regression curve is plotted with the P values indicated (*, P < 0.05; ***, P < 0.001).

References

    1. Sedaghat AR, German J, Teslovich TM, Cofrancesco J, Jr, Jie CC, Talbot CC, Jr, Siliciano RF. 2008. Chronic CD4+ T-cell activation and depletion in human immunodeficiency virus type 1 infection: type I interferon-mediated disruption of T-cell dynamics. J. Virol. 82:1870–1883. 10.1128/JVI.02228-07 - DOI - PMC - PubMed
    1. Hyrcza MD, Kovacs C, Loutfy M, Halpenny R, Heisler L, Yang S, Wilkins O, Ostrowski M, Der SD. 2007. Distinct transcriptional profiles in ex vivo CD4+ and CD8+ T cells are established early in human immunodeficiency virus type 1 infection and are characterized by a chronic interferon response as well as extensive transcriptional changes in CD8+ T cells. J. Virol. 81:3477–3486. 10.1128/JVI.01552-06 - DOI - PMC - PubMed
    1. Homann S, Smith D, Little S, Richman D, Guatelli J. 2011. Upregulation of BST-2/tetherin by HIV infection in vivo. J. Virol. 85:10659–10668. 10.1128/JVI.05524-11 - DOI - PMC - PubMed
    1. Neil SJ, Zang T, Bieniasz PD. 2008. Tetherin inhibits retrovirus release and is antagonized by HIV-1 Vpu. Nature 451:425–430. 10.1038/nature06553 - DOI - PubMed
    1. Van Damme N, Goff D, Katsura C, Jorgenson RL, Mitchell R, Johnson MC, Stephens EB, Guatelli J. 2008. The interferon-induced protein BST-2 restricts HIV-1 release and is downregulated from the cell surface by the viral Vpu protein. Cell Host Microbe 3:245–252. 10.1016/j.chom.2008.03.001 - DOI - PMC - PubMed

Publication types

MeSH terms

Substances

LinkOut - more resources