. 2014 Mar 12;34(11):3841-53.
doi: 10.1523/JNEUROSCI.4992-13.2014.

Spinal glutamatergic neurons defined by EphA4 signaling are essential components of normal locomotor circuits

Affiliations

Spinal glutamatergic neurons defined by EphA4 signaling are essential components of normal locomotor circuits

Lotta Borgius et al. J Neurosci. .

Abstract

EphA4 signaling is essential for the spatiotemporal organization of neuronal circuit formation. In mice, deletion of this signaling pathway causes aberrant midline crossing of axons from both brain and spinal neurons and the complete knock-outs (KOs) exhibit a pronounced change in motor behavior, where alternating gaits are replaced by a rabbit-like hopping gait. The neuronal mechanism that is responsible for the gait switch in these KO mice is not known. Here, using intersectional genetics, we demonstrate that a spinal cord-specific deletion of EphA4 signaling is sufficient to generate the overground hopping gait. In contrast, selective deletion of EphA4 signaling in forebrain neurons, including the corticospinal tract neurons, did not result in a change in locomotor pattern. The gait switch was attributed to the loss of EphA4 signaling in excitatory Vglut2+ neurons, which is accompanied by an increased midline crossing of Vglut2+ neurons in the ventral spinal cord. Our findings functionally define spinal EphA4 signaling in excitatory Vglut2+ neurons as required for proper organization of the spinal locomotor circuitry, and place these cells as essential components of the mammalian locomotor network.

Keywords: EphA4; central pattern generator; locomotion; spinal cord; α-chimaerin.


Figures
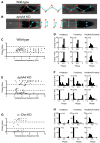
Figure 1.
Figure 1.
Locomotor pattern in freely moving wild-type, ephA4 KO and α-Chn KO mice. A, B, Illustration of locomotor pattern in wild-type (A) and ephA4 KO (B) mice. Hindlimb movements are represented by red dots, and forelimb movements by light-blue dots. C, E, G, Frequency-phase relationship of the locomotor gait in wild-type (C; N = 5), ephA4 KO (E; N = 7), and α-Chn KO mice (G; N = 5). D, F, H, Phase histograms showing the phase values between indicated pairs of limbs divided in low-frequency (≤4Hz, top) and high-frequency (>4Hz, bottom) locomotion for wild-type (D), ephA4 KO (F), and α-Chn KO (H) mice. The same datasets were used in C and D, E and F, and G and H; n indicates total amount of analyzed steps.
Figure 2.
Figure 2.
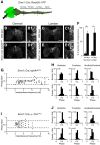
Cortical deletion of ephA4 or α-Chn does not lead to a change in overground locomotor pattern. A, Expression of Emx1::Cre visualized by the expression of YFP in the Emx1::Cre; Rosa26::YFP mice. Recombination is exclusively detected in the cortex and no recombination is visible in the spinal cord. The injection site of biotinylated dextran amine (BDA) unilateral in motor cortex is shown by a black arrowhead. The location of the transverse sections showing CST branching in B–E is marked with dashed lines. B–E, Transverse sections showing anterograde tracing with BDA of CST axons in wild-type and Emx1::Cre; ephA4−/Flox mice in the cervical enlargement (C3–C6; B, D) and in the lumbar region (L1–L2; C, E). B1–E1, Enlargements of the boxed areas in B–E. The CC is indicated by a white arrowhead. F, Quantification of sections with CST axons crossing the midline dorsal to the CC in wild-type and Emx1::Cre; ephA4−/Flox mice. Significantly more sections with crossing axons were detected in Emx1::Cre; EphA4−/Flox mice (Mut) compared with wild-type mice (WT), both in the cervical enlargement, C3–C6 (78.8 ± 6.5% against 6.7 ± 5.9%, p < 0.01) and in the lumbar area, L1–L2 (81.5 ± 15.8% against 7.1 ± 2.0% p < 0.05), (mean ± SD; N = 2 for each genotype, 30–50 sections per area and animal). Scale bars: B–E, 300 μm; B1–E1, 50 μm. G, I, Frequency-phase relationship of the locomotor gait in Emx1::Cre; ephA4−/Flox (N = 6) and Emx1::Cre; α-Chn−/Flox (N = 5) mice. H, J, Phase histograms showing the phase values between indicated pairs of limbs divided in low-frequency (≤4Hz, top) and high-frequency (>4Hz, bottom) locomotion for Emx1::Cre; ephA4−/Flox (H) and Emx1::Cre; α-Chn−/Flox (J) mice. The same datasets were used in G–J; n indicates total amount of analyzed steps.
Figure 3.
Figure 3.
Selective deletion of EphA4 from the spinal cord leads to a hopping hindlimb gait. A, Expression of Hoxb8::Cre visualized by the expression of YFP in the Hoxb8::Cre; Rosa26::YFP mice. Recombination is exclusively detected in the spinal cord with a rostrocaudal limit at the fourth cervical root (C4) indicated by an arrow. B, Frequency-phase relationship of the locomotor gait in Hoxb8::Cre; ephA4−/Flox (N = 5) mice. C, Phase histograms showing the phase values between indicated pairs of limbs divided in low-frequency (≤ 4Hz, top) and high-frequency (>4Hz, bottom) locomotion for Hoxb8::Cre; ephA4−/Flox mice using the same dataset as shown in B; n indicates total amount of analyzed steps.
Figure 4.
Figure 4.
In vivo locomotion in Vglut2::Cre; ephA4−/Flox and Vglut2::Cre; α-Chn−/Flox mice. A, Frequency-phase relationship of the locomotor gait in Vglut2::Cre; ephA4−/Flox (N = 7) mice. B, Phase histograms showing the phase values between indicated pairs of limbs divided in low-frequency (≤4Hz, top) and high-frequency (>4Hz, bottom) locomotion for Vglut2::Cre; ephA4−/Flox mice using the same dataset as shown in A. C, Frequency-phase relationship of the locomotor gait in Vglut2::Cre; α-Chn−/Flox (N = 4) mice. D, Phase histograms showing the phase values between indicated pairs of limbs divided in low-frequency (≤4Hz, top) and high-frequency (>4Hz, bottom) locomotion for Vglut2::Cre; α-Chn−/Flox mice using the same dataset as shown in C; n indicates total amount of analyzed steps.
Figure 5.
Figure 5.
Locomotor-like activity in isolated spinal cord preparations. A, Raw VR recordings from a Vglut2::Cre; ephA4−/Flox mutant during drug-evoked locomotor-like activity showing left (L) and right (R) lumbar (L) 2 and 5 VRs (upper traces), with corresponding smoothed rectified traces below. B, Circular plot showing left–right (LL2-RL2) coordination obtained from the preparation shown in A. C, Circular plot showing left–right (LL2-RL2) coordination during drug-evoked locomotor-like activity from all Vglut2::Cre; ephA4−/Flox mutants examined (N = 9). D, Stimulation of descending fibers in a Vglut2::Cre; ephA4−/Flox mutant. E, Circular plot showing left–right (LL2-RL2) coordination during descending stimulation from all Vglut2::Cre; ephA4−/Flox mutants examined (N = 6, left). F, Raw VR recordings from a Vglut2::Cre; α-Chn−/Flox mutant during drug-evoked locomotor-like activity with corresponding smoothed rectified traces below. G, Circular plot showing left–right (LL2-RL2) coordination obtained from the preparation shown in F. H, Circular plot showing left–right (LL2-RL2) coordination during drug-evoked locomotor-like activity from all Vglut2::Cre; α-Chn−/Flox mutants examined (N = 11). I, Proportion of synchronous activity at different locomotor frequencies in vitro in Vglut2::Cre; α-Chn−/Flox mutants (N = 14) and α-Chn−/Flox (control, N = 12).
Figure 6.
Figure 6.
Increased midline crossing of Vglut2-positive neurons in the ventral spinal cord. A, Schematic picture illustrating the site for the rhodamine tracer application (red box). B, C, Transverse sections of the L2 segment showing rhodamine dextran back-labeling of neurons and axons in Vglut2::Cre (B) or Vglut2::Cre; ephA4−/Flox mice (C). DF1, Transverse sections from the L2 segment showing increase in rhodamine dextran back-labeled neurons (red) that are Vglut2-positive (green), identified by Cre expression, in the Vglut2::Cre;ephA4−/Flox KOs compared with the Vglut2::Cre controls. G, Quantification of retrograde-labeled CNs (left) labeled by rhodamine dextran in Vglut2::Cre compared with Vglut2::Cre;ephA4−/Flox mice in, as well as the proportion of retrograde-labeled CNs that are Vglut2 positive (right) in Vglut2::Cre compared with Vglut2::Cre; ephA4−/Flox mice; all values normalized to Vglut2-negative neurons (N = 3 in each group; mean ± SD, **p = < 0.001). The CC is indicated by a white circle. Scale bars: B, C, 200 μm; D–F, D1–F1, 100 μm.
Figure 7.
Figure 7.
Altered dorsal funiculus (DF) anatomy is correlated with a dorsal gap in EphrinB3 expression. A, Confocal images showing the shape of the dorsal commissure in the lumbar spinal cord from newborn (P0–P2) mice. The CC is labeled in red. B, Schematic figure of the transverse spinal cord showing the calculated distances in C and F. A indicates the distance between the CC and the ventral border of the DF, and B indicates the distance between the CC and the dorsal edge of the spinal cord. C, Bar graph showing the relative distance between the CC and the ventral edge of the DF normalized to the total distance of the spinal cord dorsal to the CC. Data are represented as mean ± SD. D, Bar graph showing the total area of the DF. Data are represented as mean ± SD. E, Confocal images showing the EphrinB3 expression in the lumbar spinal cord from P0–P2 animals. White arrowhead indicates the CC and the white arrow indicates the gap in the EphrinB3 barrier. F, Bar graph showing the dorsal gap in EphrinB3 expression normalized to the total distance from the CC to the ventral edge of the DF. Data are represented as mean ± SD, **p < 0.001. Scale bars: A, 100 μm; E, 200 μm.
Figure 8.
Figure 8.
Preservation of left–right VR coupling after lesion of the dorsal commissure in Vglut2::Cre; α-Chn−/Flox mice. A, Locomotor-like activity induced by application of NMDA and 5-HT before (top) and after (bottom) cutting the dorsal commissure in Vglut2::Cre; α-Chn−/Flox mice. B, Circular plot showing data from the preparation in panel A before (left) and after (right) the dorsal cut. (C) Circular plot with data from all Vglut2::Cre; α-Chn−/Flox (N = 6) and control (α-Chn−/Flox, N = 4) preparations before (left) and after (right) the dorsal cut. Black filled circles correspond to Vglut2::Cre; α-Chn−/Flox and white circles to controls. D, Anatomical confirmation of the dorsal commissure lesion in the preparation shown in A and B. White arrowhead indicates the CC and the black arrow indicates the lesion. Scale bar, 200 μm.

References

    1. Akay T, Acharya HJ, Fouad K, Pearson KG. Behavioral and electromyographic characterization of mice lacking EphA4 receptors. J Neurophysiol. 2006;96:642–651. doi: 10.1152/jn.00174.2006. - DOI - PubMed
    1. Asante CO, Chu A, Fisher M, Benson L, Beg A, Scheiffele P, Martin J. Cortical control of adaptive locomotion in wild-type mice and mutant mice lacking the ephrin-Eph effector protein alpha2-chimaerin. J Neurophysiol. 2010;104:3189–3202. doi: 10.1152/jn.00671.2010. - DOI - PMC - PubMed
    1. Beg AA, Sommer JE, Martin JH, Scheiffele P. alpha2-Chimaerin is an essential EphA4 effector in the assembly of neuronal locomotor circuits. Neuron. 2007;55:768–778. doi: 10.1016/j.neuron.2007.07.036. - DOI - PubMed
    1. Borgius L, Restrepo CE, Leao RN, Saleh N, Kiehn O. A transgenic mouse line for molecular genetic analysis of excitatory glutamatergic neurons. Mol Cell Neurosci. 2010;45:245–257. doi: 10.1016/j.mcn.2010.06.016. - DOI - PubMed
    1. Bui TV, Akay T, Loubani O, Hnasko TS, Jessell TM, Brownstone RM. Circuits for grasping: spinal dI3 interneurons mediate cutaneous control of motor behavior. Neuron. 2013;78:191–204. doi: 10.1016/j.neuron.2013.02.007. - DOI - PMC - PubMed

Publication types

MeSH terms