. 2014 Mar 12;34(11):3910-23.
doi: 10.1523/JNEUROSCI.2679-13.2014.

Information processing in the primate basal ganglia during sensory-guided and internally driven rhythmic tapping

Affiliations

Information processing in the primate basal ganglia during sensory-guided and internally driven rhythmic tapping

Ramón Bartolo et al. J Neurosci. .

Abstract

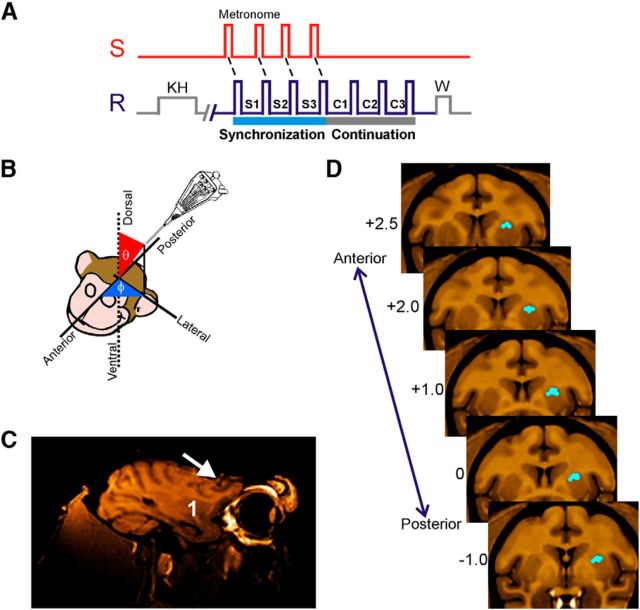
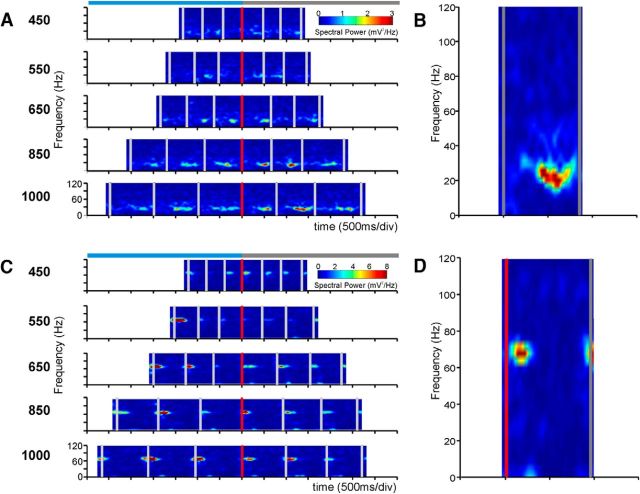
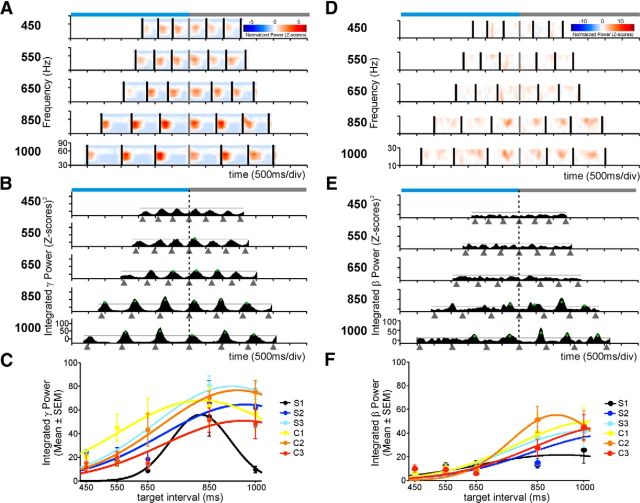
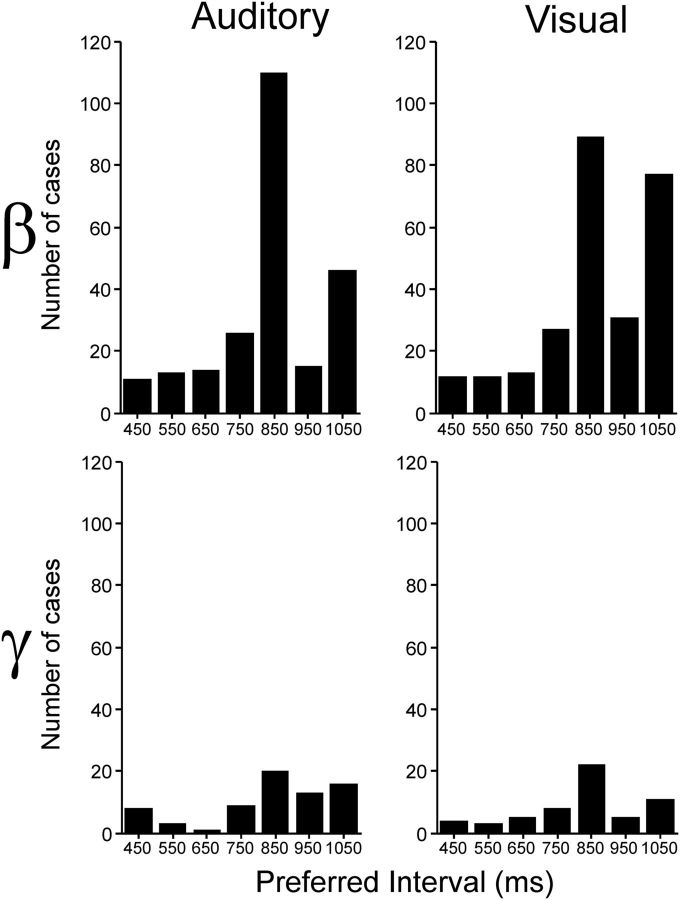
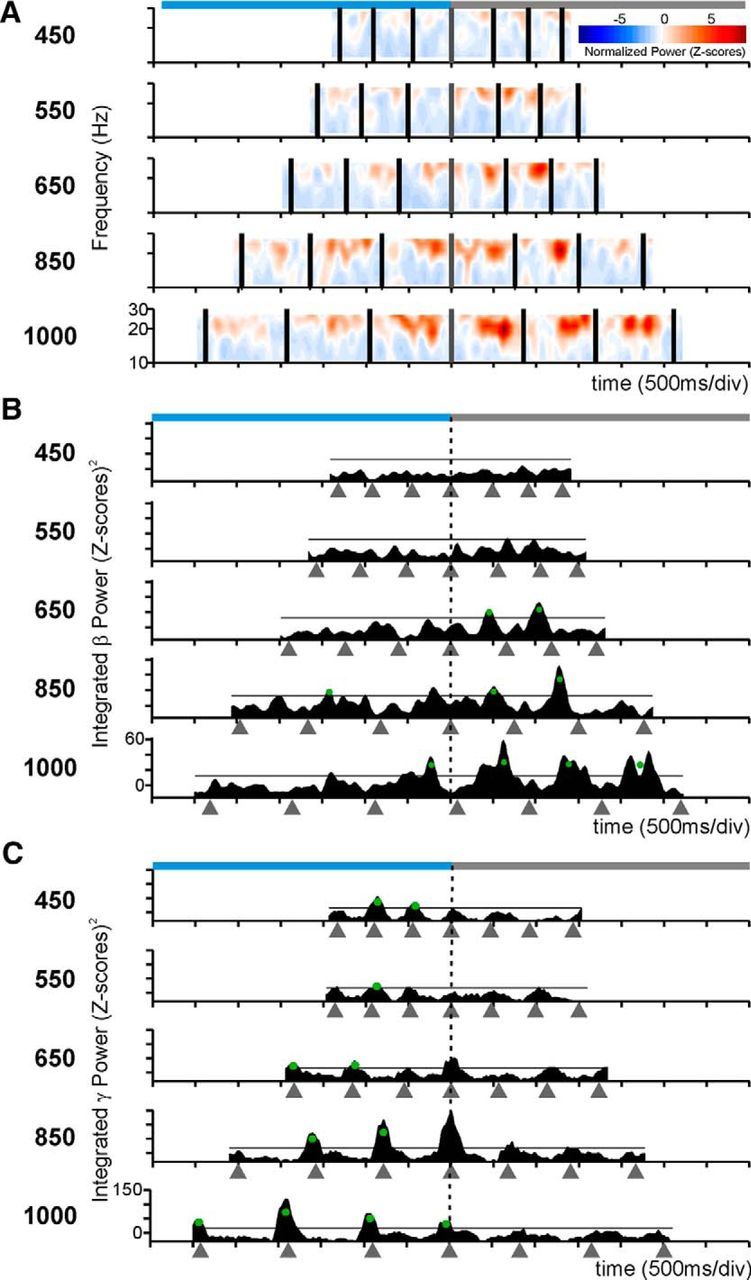
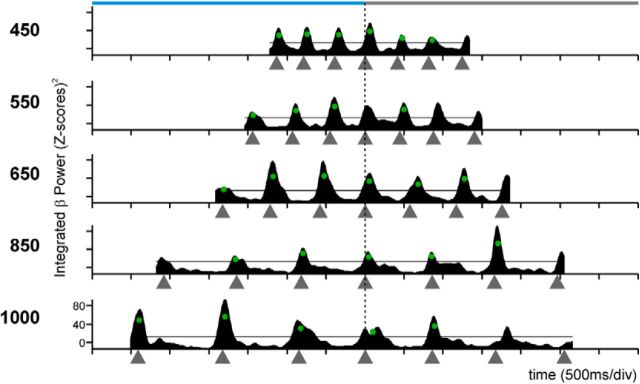
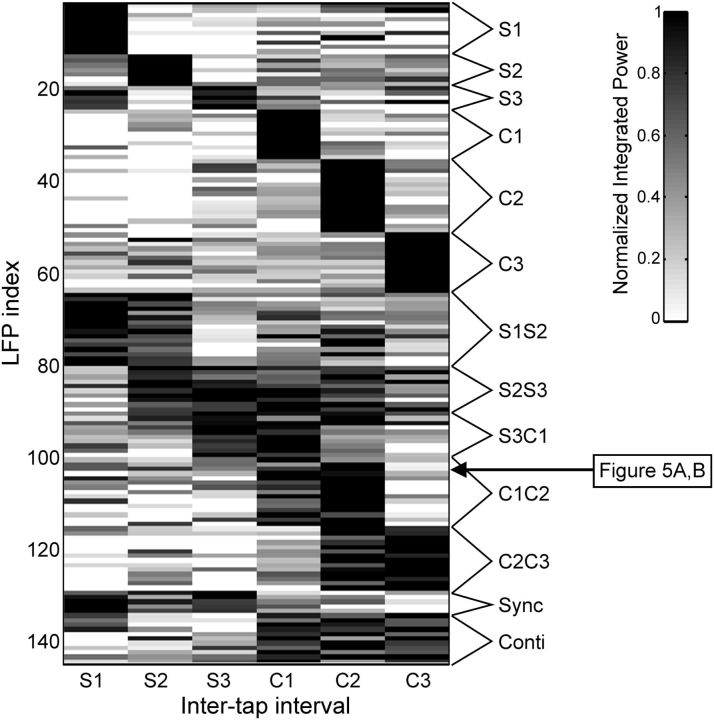
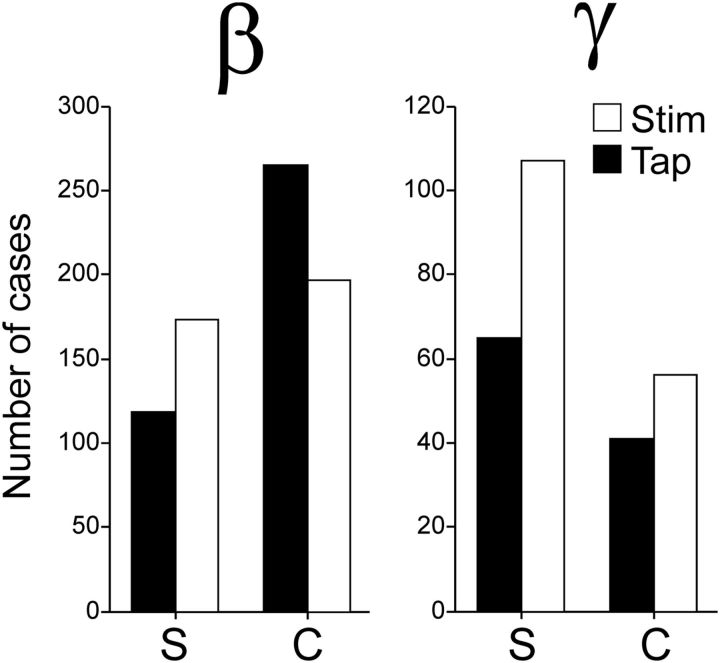
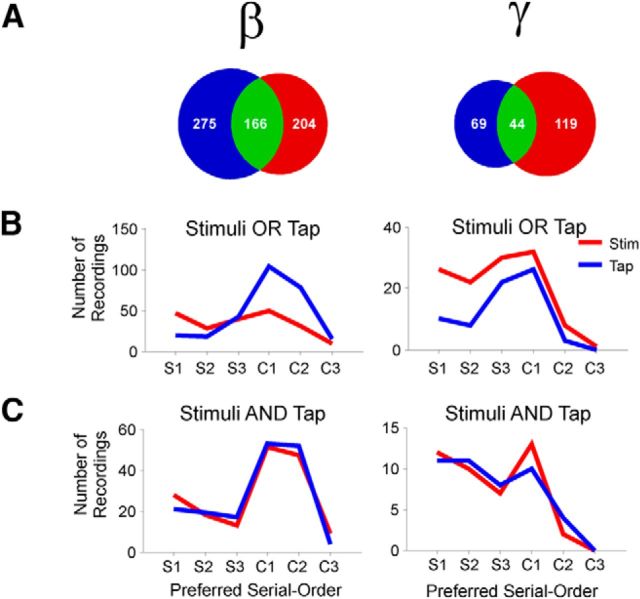
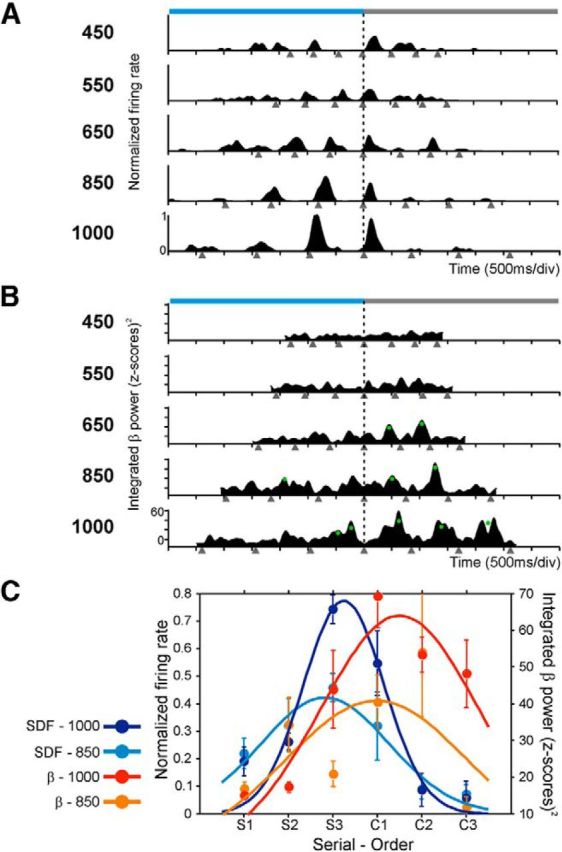
Gamma (γ) and beta (β) oscillations seem to play complementary functions in the cortico-basal ganglia-thalamo-cortical circuit (CBGT) during motor behavior. We investigated the time-varying changes of the putaminal spiking activity and the spectral power of local field potentials (LFPs) during a task where the rhythmic tapping of monkeys was guided by isochronous stimuli separated by a fixed duration (synchronization phase), followed by a period of internally timed movements (continuation phase). We found that the power of both bands and the discharge rate of cells showed an orderly change in magnitude as a function of the duration and/or the serial order of the intervals executed rhythmically. More LFPs were tuned to duration and/or serial order in the β- than the γ-band, although different values of preferred features were represented by single cells and by both bands. Importantly, in the LFPs tuned to serial order, there was a strong bias toward the continuation phase for the β-band when aligned to movements, and a bias toward the synchronization phase for the γ-band when aligned to the stimuli. Our results suggest that γ-oscillations reflect local computations associated with stimulus processing, whereas β-activity involves the entrainment of large putaminal circuits, probably in conjunction with other elements of CBGT, during internally driven rhythmic tapping.

Keywords: interval tuning; rhesus monkey; spikes and LFPs; synchronization-continuation task; timing.


Figures

Figure 1.
Figure 1.
SCT and location of recording sites. A, Sensory and motor events in the SCT. S, Stimuli with an isochronous interval; R, push-button press; KH, key hold; W, reward; S1–S3, intertap intervals of the synchronization phase; C1–C3, intervals of the continuation phase. B, Navigation method to reach the dorsal putamen. Guiding cannulae were oriented in spherical coordinates with respect to the anterior–posterior, medial–lateral, and dorsal–ventral axes of the monkey's head. MRI was used to calculate the appropriate coordinates and to verify the trajectory. C, MRI in the parasagittal plane where the white arrow points to the trajectory of an MRI-compatible cannula and the number 1 is located on the putamen. D, Representative standard coronal sections of the macaque brain (Frey et al., 2011) illustrating the area in which LFPs were recorded for one monkey. The numbers to the left are millimeters with respect to the anterior commissure. Blue dots correspond to the recording sites.
Figure 2.
Figure 2.
Transient increases in the spectral power of LFPs. A, Raw, unsmoothed spectrograms of a single LFP recording. Each plot corresponds to the target interval indicated on the left. The vertical axis is the frequency of the oscillatory activity, and the horizontal axis is the time during the performance of the task. Gray vertical bars represent the times at which the monkey tapped on the push-button. All the spectrograms are aligned to the last tap of the synchronization phase (red vertical bar). Top, Light-blue and gray horizontal bars represent the synchronization and continuation phases, respectively. Each spectrogram is the average of 5 trials. B, Close-up of the C2 intertap interval of the 1000 ms plot in A, showing that transient power increases occurred in the β-band. C, Spectrograms of a different LFP recording showing transient power increases in a larger frequency than in A. D, Close-up of the C1 intertap interval of the 1000 ms plot in C showing that the transient power increments occurred in the γ-band.
Figure 3.
Figure 3.
Time-varying modulations in the γ- and β-power of two different LFP signals that show selectivity to interval duration. A, Normalized spectrograms in the γ-band. Each plot corresponds to the target interval indicated on the left. The horizontal axis is the time during the performance of the task. Black vertical bars represent the times at which the monkey tapped on the push-button. All the spectrograms are aligned to the last tap of the synchronization phase (gray vertical bar). Top, Light-blue and gray horizontal bars represent the synchronization and continuation phases, respectively. B, Plots of the integrated power time-series for each target duration. Gray triangles below the time axis represent tap times. Green dots correspond to power modulations above the 1 SD threshold (black solid line) for a minimum of 50 ms across trials. The vertical dotted line indicates the last tap of the synchronization phase. C, Interval tuning in the integrated γ power. Dots are the mean ± SEM, and lines indicate the fitted Gaussian functions. Tuning functions were calculated for each of the six elements of the task sequence (S1–S3 for synchronization and C1–C3 for continuation) and are color-coded (inset). D–F, Same as in A–C for a different LFP recording that showed β-band power modulations that were selective for interval duration.
Figure 4.
Figure 4.
Distribution of preferred interval durations separated by frequency band (β or γ) and modality (auditory or visual).
Figure 5.
Figure 5.
Dual selectivity to the interval duration and the task phase in the LFP β power. A, β-Band spectrogram of an LFP recording with power increments during the continuation phase of long interval durations. B, Integrated power of the β-band for the spectrogram in A. C, Integrated power of the γ-band of another LFP with larger oscillatory activity for longer durations during the synchronization phase in the visual condition. The same conventions as in Figure 3.
Figure 6.
Figure 6.
Integrated power of a recording site with sensorimotor responses. The χ2 test revealed that the modulations were uniformly distributed across durations and serial order (p > 0.05). The same conventions as in Figure 3B.
Figure 7.
Figure 7.
LFP selectivity to the serial order and task phase during the SCT. K-means clustering of the normalized probability of power increments in the β-band for the LFP recordings that showed significant effects on serial order (Friedman test) during the visual interval marker condition. The data were classified as sequence selective to one, two or three consecutive elements of the SCT according to the magnitude of the power modulations (grayscale). Each row corresponds to one LFP recording, and each column corresponds to one element of the SCT sequence. The arrow corresponds to the LFP recording shown in Figure 5A, B.
Figure 8.
Figure 8.
Total number of LFPs with preferred serial order during the synchronization (S) or continuation (C) phase of the SCT across frequency bands (β or γ) pooling auditory and visual marker data. Filled and empty bars represent tuned LFPs when aligned to tap times or stimuli times, respectively. The difference between task phases was significant for tap-aligned LFPs in both bands (χ2 test, p < 0.002), but only for the γ-band for the stimulus-aligned LFPs (χ2 test, p < 0.0001).
Figure 9.
Figure 9.
Distribution of preferred serial order across frequency bands (β or γ) and signal alignments (Tap or Stimuli). A, Venn diagrams showing the different sets of serial order tuned LFPs, namely, only tuned when aligned to tapping times (blue), only tuned when aligned to stimuli times (red), or tuned in both alignments (green). B, Distributions of the preferred serial order of LFPs tuned when tap-aligned only (blue) or stimulus-aligned only (red). The six elements of the task sequence are depicted in the horizontal axis: S1–S3, the synchronization phase; and C1–C3, the continuation phase. C, Preferred serial order of LFPs from the green sets in A, namely, for those LFPs that were tuned to serial order when aligned to both the tap (blue) and the stimulus (red).
Figure 10.
Figure 10.
Coherence analysis. A, Mean coherence magnitude (±SEM) as a function of the distance between the electrode tips. Distance bins are 800 μm wide. Numbers above each dot indicate the number of cases (same for magnitude and phase). B, Mean coherence phase angle (±SEM) as a function of distance. Open circles represent β-band; filled circles represent γ-band. Dotted and solid lines indicate the linear regression fits for β- and γ-band, respectively.
Figure 11.
Figure 11.
Phase locking of unitary spikes with LFP oscillations. A, Representative β bandpass filtered and normalized LFP traces (blue) and the corresponding spikes from a single unit in the same recording site (black ticks). Tapping times are displayed as red dots. For each target interval, the top shows the LFP signal of a whole trial, where the segment enclosed within the green box is amplified in the bottom. B, Phase histograms showing the mean phases of all significantly phase-locked units to β or γ LFP activity. The red line indicates the mean resultant vector of the population. Bottom right insets, Location of the mean population phase in a standard sinusoid. The green asterisk in the β histogram indicates the phase of unit in A.
Figure 12.
Figure 12.
Distributions of preferred intervals (PI) and preferred serial order (PS) for cells and LFPs simultaneously recorded in the same electrode. A, Distributions of PI for spiking activity (black line) and β (left) or γ (right) LFPs (red line) that were tuned to interval. B, Distributions of PS for spiking activity (black line) and β (left, red line) or γ-band oscillations (right, red line) that were tuned to serial order. C, Distributions of the difference in PI between spikes and LFPs for the β- (left) and γ-band (right). D, Distributions of the PS difference between spikes and LFPs for the β- (left) and γ-band (right).
Figure 13.
Figure 13.
Serial-order selectivity of the activity of a cell and the β power that were simultaneously recorded in the same electrode. A, Spike density functions of a cell that was selective for long durations through the last interval of the synchronization and the first interval of the continuation phase of the SCT. B, Integrated power of the corresponding β-band activity that was tuned also for long durations, but during the first two intervals of the continuation phase. This implies that the cell activity preceded the changes in the power of β oscillations. Same conventions as in Figure 5. C, Serial-order tuning in the spike density functions and in the integrated β power. Dots are the mean ± SEM, and lines indicate the fitted Gaussian functions. Tuning functions were calculated for each target interval across the serial order sequence S1–C3 and are color-coded (inset). Only fittings for the intervals of 850 and 1000 ms are shown.

References

    1. Baker SN, Olivier E, Lemon RN. Coherent oscillations in monkey motor cortex and hand muscle EMG show task-dependent modulation. 1997;501:225–241. - PMC - PubMed
    1. Bartolo R, Merchant H. Learning and generalization of time production in humans: rules of transfer across modalities and interval durations. Exp Brain Res. 2009;197:91–100. doi: 10.1007/s00221-009-1895-1. - DOI - PubMed
    1. Batschelet E. Circular statistics in biology. London: Academic; 1981.
    1. Berens P. CircStat: a MATLAB Toolbox for circular statistics. J Stat Softw. 2009;31:1–21.
    1. Berke JD. Fast oscillations in cortical-striatal networks switch frequency following rewarding events and stimulant drugs. Eur J Neurosci. 2009;30:848–859. doi: 10.1111/j.1460-9568.2009.06843.x. - DOI - PMC - PubMed

Publication types

LinkOut - more resources