. 2014 Mar 12;34(11):4076-81.
doi: 10.1523/JNEUROSCI.4825-13.2014.

Behaviorally gated reduction of spontaneous discharge can improve detection thresholds in auditory cortex

Affiliations

Behaviorally gated reduction of spontaneous discharge can improve detection thresholds in auditory cortex

Bradley N Buran et al. J Neurosci. .

Abstract

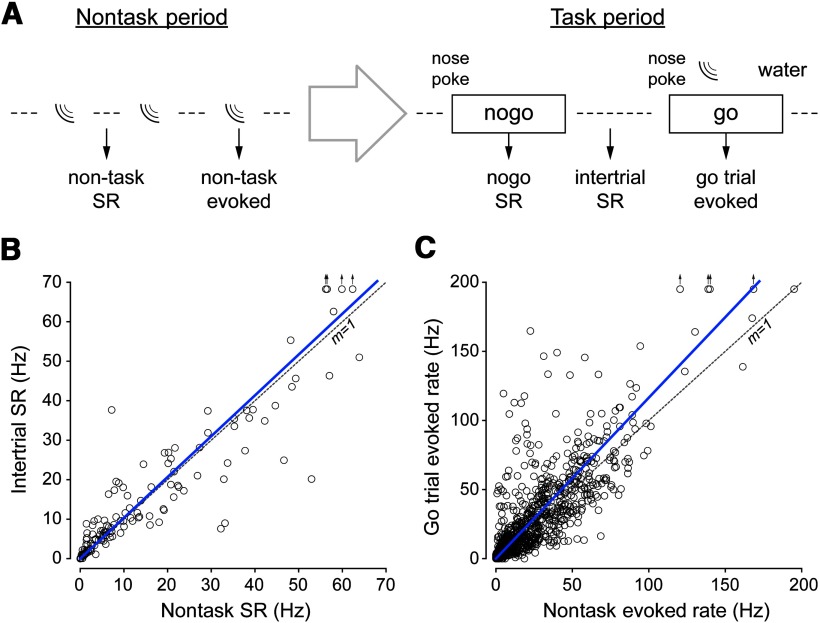
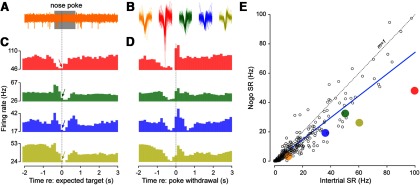
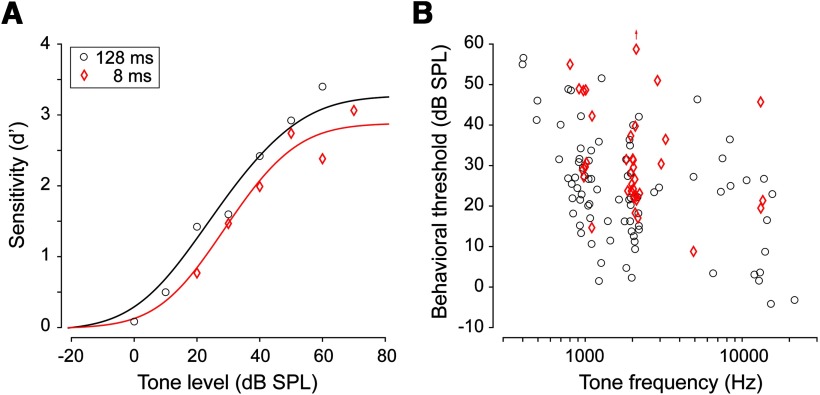
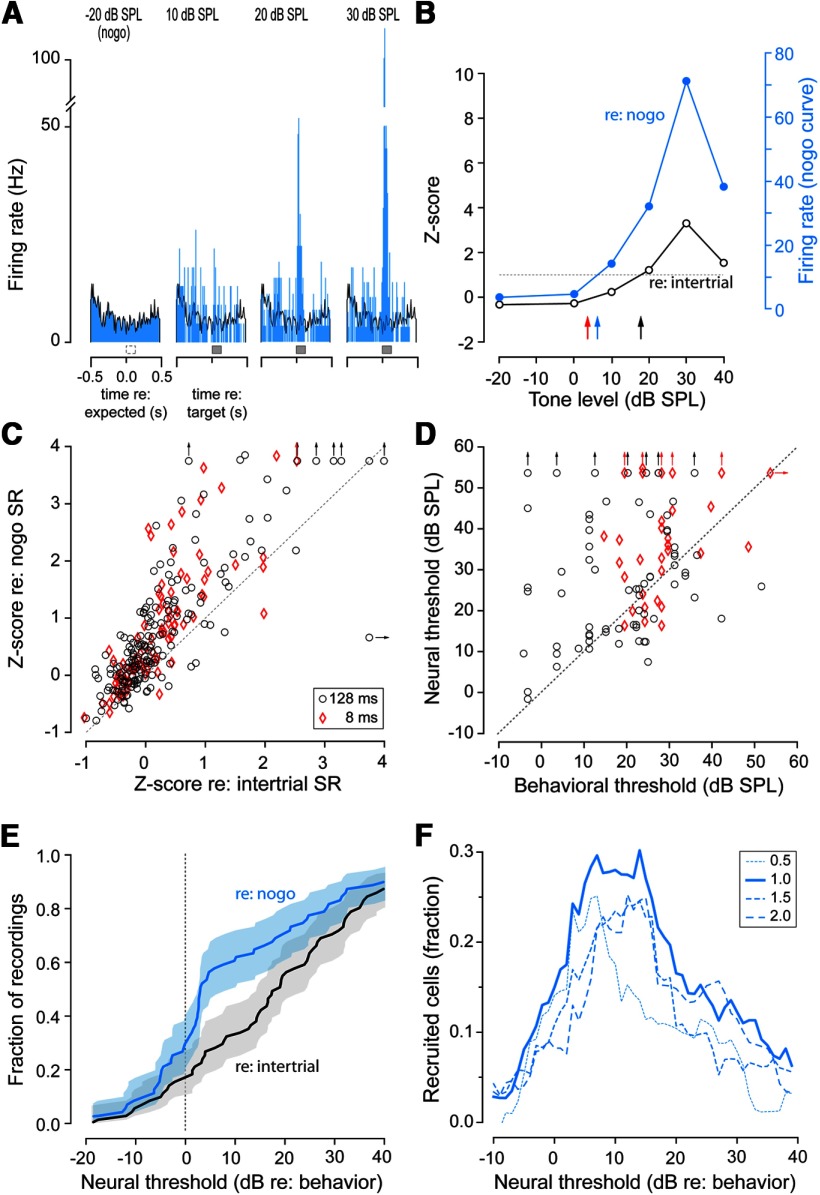
Animals often listen selectively for particular sounds, a strategy that could alter neural encoding mechanisms to maximize the ability to detect the target. Here, we recorded auditory cortex neuron responses in well trained, freely moving gerbils as they performed a tone detection task. Each trial was initiated by the animal, providing a predictable time window during which to listen. No sound was presented on nogo trials, permitting us to assess spontaneous activity on trials in which a signal could have been expected, but was not delivered. Immediately after animals initiated a trial, auditory cortex neurons displayed a 26% reduction in spontaneous activity. Moreover, when stimulus-driven discharge rate was referenced to this reduced baseline, a larger fraction of auditory cortex neurons displayed a detection threshold within 10 dB of the behavioral threshold. These findings suggest that auditory cortex spontaneous discharge rate can be modulated transiently during task performance, thereby increasing the signal-to-noise ratio and enhancing signal detection.

Keywords: attention; auditory cortex; auditory perception; detection threshold; expectation; spontaneous activity.


Figures

Figure 1.
Figure 1.
Effect of environmental context on neural activity. A, Schematic of an experiment session. During a nontask block (left), we acquired neural responses to tone stimuli (nontask evoked; sound wave symbols) identical to those presented during task performance. SR was assessed in between stimulus presentations (nontask SR). After a brief period (large, open arrow), the nose-poke and water spout were placed in the chamber and the task block was started. During the task block (right), animals initiated trials via a nose-poke. A water reward was delivered for a correct response on go trials. The analyses in subsequent figures are based on the discharge rate between trials (intertrial SR), during nogo trials at the expected target latency (nogo SR), and in response to the target (go trial evoked). B, SRs recorded during the nontask block are equal to those recorded during the intertrial period of the task block, as shown by the linear regression (blue line). For reference, a dashed line with a slope of 1 is plotted. C, The relationship between sound-evoked rates during the nontask block and the task block were more variable than for SR; however, on average, sound-evoked rates during the task block were significantly higher than in the nontask condition, as shown by the linear regression (blue line). Only data for which at least 10 trials were obtained from the task blocks were included. A small number of points with values beyond the axis range are indicated by arrows.
Figure 2.
Figure 2.
SR of auditory cortex neurons is reduced following trial initiation. A, Raw multiunit trace (orange) from a representative nogo trial with the duration of the nose-poke bounded by the gray rectangle. B, Action potential waveforms extracted from the exemplar neurons shown in C and D. C, D, Four peristimulus time histograms are shown for nogo trials with all epochs aligned to the onset of the expected tone presentation time (C) or poke withdrawal (D). During go trials, the signal would have occurred 400 ms after the nose-poke and the arrow in each histogram points to this expected tone presentation time (C). This bin was used for estimating the SR during nogo trials. Bin width is 128 ms. E, SR during nogo trials versus intertrial SR for all multiunits. The dashed line indicates unity and the thick blue line indicates the linear regression through the data points. The data points extracted from the exemplar neurons displayed in AD are indicated by their respective colors.
Figure 3.
Figure 3.
Behavioral performance on the tone detection task. A, Example psychometric functions from a single session for 8 ms (red diamond) and 128 ms (black circle) tones. Threshold was estimated by fitting a psychometric function (solid line) to the d′ values (individual points). Threshold was defined as the tone level where d′ = 1. B, Distribution of behavioral thresholds for 8 and 128 ms tones for all sessions from all animals. In general, lower thresholds were obtained with 128 ms stimuli.
Figure 4.
Figure 4.
Relationship between neural and behavioral thresholds. A, Peristimulus time histograms from a multiunit recorded during a single behavioral session illustrating the response to nogo trials and go trials at 10, 20, and 30 dB SPL to 128 ms tones. Bin width is 10 ms. The nogo histogram is replotted over each go histogram (black line) to illustrate the evoked response relative to the reduced SR. B, Rate-level function for the multiunit shown in A plotted as the Z-score referenced to both intertrial (black) and nogo SR (blue). Blue and black arrows indicate the corresponding neural threshold (as defined by Z-score = 1). The red arrow indicates the behavioral threshold for that session. C, Comparison of methods for computing the Z-score for near-threshold go trials (i.e., within 5 dB of behavioral threshold). In general, using the SR during nogo trials as a reference yielded larger Z-scores compared with using the intertrial SR. Data from both 8 ms (red diamonds) and 128 ms (black circles) tones are shown. Dashed line indicates unity. Values beyond the axis range are indicated by arrows. D, Neural thresholds (as estimated from the Z-score referenced to the nogo SR) compared with behavioral thresholds. E, Cumulative distribution of neural thresholds relative to behavioral thresholds for 128 ms tones only. Thresholds as estimated by comparing with intertrial SR (black) are compared with thresholds as estimated by comparing with nogo SR (blue), indicating that a much larger fraction of multiunits have thresholds within 10 dB of the behavioral threshold when referenced to nogo SR. F, Fraction of cells recruited by using the SR during nogo trials as a reference, as assessed by the difference between the nogo and intertrial cumulative distribution function in E. This is repeated for multiple Z-score criteria. Regardless of the Z-score used to estimate neural threshold, the largest recruitment of neurons occurs within 5–10 dB of threshold.

References

    1. Atiani S, Elhilali M, David SV, Fritz JB, Shamma SA. Task difficulty and performance induce diverse adaptive patterns in gain and shape of primary auditory cortical receptive fields. Neuron. 2009;61:467–480. doi: 10.1016/j.neuron.2008.12.027. - DOI - PMC - PubMed
    1. Cohen MR, Maunsell JH. When attention wanders: how uncontrolled fluctuations in attention affect performance. J Neurosci. 2011;31:15802–15806. doi: 10.1523/JNEUROSCI.3063-11.2011. - DOI - PMC - PubMed
    1. Dai H, Wright BA. Detecting signals of unexpected or uncertain durations. J Acoust Soc Am. 1995;98:798–806. doi: 10.1121/1.413572. - DOI - PubMed
    1. David SV, Fritz JB, Shamma SA. Task reward structure shapes rapid receptive field plasticity in auditory cortex. Proc Natl Acad Sci U S A. 2012;109:2144–2149. doi: 10.1073/pnas.1117717109. - DOI - PMC - PubMed
    1. Elhilali M, Fritz JB, Chi TS, Shamma SA. Auditory cortical receptive fields: stable entities with plastic abilities. J Neurosci. 2007;27:10372–10382. doi: 10.1523/JNEUROSCI.1462-07.2007. - DOI - PMC - PubMed

Publication types

LinkOut - more resources