. 2014 May;42(9):5917-28.
doi: 10.1093/nar/gku175. Epub 2014 Mar 12.

Altering murine leukemia virus integration through disruption of the integrase and BET protein family interaction

Affiliations

Altering murine leukemia virus integration through disruption of the integrase and BET protein family interaction

Sriram Aiyer et al. Nucleic Acids Res. 2014 May.

Abstract

We report alterations to the murine leukemia virus (MLV) integrase (IN) protein that successfully result in decreasing its integration frequency at transcription start sites and CpG islands, thereby reducing the potential for insertional activation. The host bromo and extraterminal (BET) proteins Brd2, 3 and 4 interact with the MLV IN protein primarily through the BET protein ET domain. Using solution NMR, protein interaction studies, and next generation sequencing, we show that the C-terminal tail peptide region of MLV IN is important for the interaction with BET proteins and that disruption of this interaction through truncation mutations affects the global targeting profile of MLV vectors. The use of the unstructured tails of gammaretroviral INs to direct association with complexes at active promoters parallels that used by histones and RNA polymerase II. Viruses bearing MLV IN C-terminal truncations can provide new avenues to improve the safety profile of gammaretroviral vectors for human gene therapy.


Figures

Figure 1.
Figure 1.
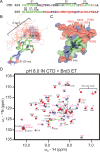
NMR analysis of MLV IN: Brd3 ET interaction. A. MLV IN CTD sequence is displayed with the following color codes: green indicates backbone amide resonance chemical shifts that were the same for IN CTD in the presence or absence of Brd3 ET at pH 8.0; red indicates backbone amide resonances that are observed in the presence of Brd3 ET, but solvent exchange broadened in the absence of complex formation, and/or amide resonances that exhibit frequency shifts upon complex formation; blue indicates backbone amide resonance assignments that could not be determined at pH 8.0 either in the presence or absence of the Brd3 ET domain. Residues for which HN amide assignments could not be determined in either free or ET-bound CTD at pH 8.0 include R337, H338, T340, K341, N342, R346, W347, A367, S385, S386, Q396, as well as proline residues P345, P350, P358, P380, P384, P398 and P408 which lack amide protons. B. Cα backbone trace, along with key structural features, of an ensemble of 20 conformers of MLV IN CTD from amino acids 329–408 (PDB ID 2M9U) is shown in this panel with the same color codes as described in panel A. C. Ribbon representation of a single MLV IN CTD conformer is shown within a transparent view of a surface space fill model. Color code is the same as in panel A with key structural features and specific amino-acid residues that show significant CSPs and/or reduced amide proton exchange broadening marked in red. All images were generated using PyMol (The PyMOL Molecular Graphics System, Version 1.2r3pre, Schrödinger, LLC.) D. NMR spectrum of the IN CTD–Brd3 ET complex. Overlay of [15N−1H]-HSQC spectra of 15N-enriched IN CTD construct IN329–408 at pH 8.0, 300 mM NaCl either with (blue) or without (red) unlabeled Brd3ET. The stoichiometric ratio of IN329–408 (1 mM) and Brd3 ET (2 mM) was 1:2 at the concentrations indicated. Backbone amide resonances that are not affected by complex formation are labeled with sequence-specific assignments in black; assigned amide resonances that are not observable due to solvent-exchange broadening in the absence of ET, but become observable upon complex formation, as well as resonances exhibiting significant CSPs upon complex formation are labeled in magenta. All amide peak resonances not observable due to solvent-exchange broadening in the absence of ET, but become observable upon complex formation are marked with black circles; some of these could not be unambiguously assigned at pH 8.0. The curved green arrows indicate the CSPs due to complex formation of the amide resonances assigned to residues L399, L403, A407 and the side-chain indole NHϵ resonance of W390. Tryptophan W347 and W369 NHϵ side chain indole resonances with significant proton exchange rate reduction due to complex formation are also indicated. Peak resonances labeled in green are assigned to the non-cleavable affinity tag.
Figure 2.
Figure 2.
MLV IN interacts with the BET family through the IN TP. A. Rotational correlation time measurements. Plot of rotational correlation time (τc) computed from 15N T1/T2 relaxation rate measurements versus molecular weight. Known monomeric protein standards are indicated in red. Data for the three IN CTD constructs (IN329–408, IN329–385 XN and IN329–385) are indicated in blue (individually) and green (in the presence of the Brd3 ET domain). The molar ratio of the IN CTD constructs and Brd3 ET proteins was 1:1 at 100 μM. Plots of the 15N T1 and T2 nuclear relaxation data for each sample are presented in Supplementary Figure S2. B. Interaction of MLV IN TP with Brd4. GST pull-down experiments performed with WT GST-MLV IN1–408 and IN ΔC construct GST-MLV IN1–385 with Brd41–720. Coomassie stain of SDS/PAG of GST pull-down products. Components of individual reactions are indicated as well as 10% of the purified Brd41–720 input sample. The predicted molecular of the GST-MLV IN1–408 fusion protein is 69 kDa. Positions of molecular weight standards are indicated on the left.
Figure 3.
Figure 3.
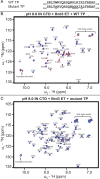
Mutating the consensus TP sequence inhibits interaction of MLV IN CTD with Brd3 ET. A. The 24-residue WT TP sequence is displayed on top and the mutant TP sequence is displayed on bottom. Underlined residues indicate amino-acid residues mutated to alanine. B. Comparison of [15N-1H]-HSQC spectra of the complex formed between 15N-enriched IN CTD (construct IN329–408) and unlabeled Brd3 ET in the presence of the WT TP (blue) and the free 15N-enriched IN CTD (construct IN329–408) spectra (red; same as Supplementary Figure S1B). The stoichiometric ratio of IN329–408 (200 μM) and Brd3 ET (200 μM) was 1:1 and the peptide was added at 3-fold molar excess (600 μM). Under these conditions, the WT TP disrupts the complex by binding to the ET domain, resulting in a spectrum for CTD that is different from that of the complex, but essentially identical to that of free IN CTD. C. Comparison of [15N-1H]-HSQC spectra of 15N-enriched IN CTD (construct IN329–408) and unlabeled Brd3 ET in the presence (red) or absence (blue) of the mutant TP. The stoichiometric ratio of IN329–408 (200 μM) and Brd3 ET (200 μM) was 1:1 and the mutant peptide was added at 3-fold excess (600 μM). The mutant TP does not disrupt the complex, and the spectrum is not changed when the peptide is added. In both panels, backbone amide resonances are labeled in black and peak resonances labeled in magenta are assigned to the non-cleavable affinity tag. Buffer conditions are as follows—buffer 1: 25 mM sodium phosphate pH 8.0, 300 mM NaCl, 50 mM potassium glutamate, 5 mM 2-mercaptoethanol. Buffer 2: 25 mM sodium phosphate pH 8.0, 360 mM NaCl, 60 mM potassium glutamate, 6 mM 2-mercaptoethanol.
Figure 4.
Figure 4.
MLV IN ΔC integrations lose association with TSS, CpG islands and known BET protein binding sites in 293 cells. A. Percentages of integration sites in 293 cells are plotted with respect to the distance from the annotated TSS compared to matched random controls (MRCs) (50). B. Percentages of integration sites are plotted with respect to the distance from the 5’ end of the nearest CpG islands compared to MRCs. C. Total BET binding sites in 293 cells. Integration sites were measured for its proximity to the 5’ boundary of known BET protein binding sites compared to MRCs. MRCs are selected randomly from the host genome respective to a restriction site and should have no relation to chromatin sites. D. BET protein chromatin binding sites that overlap with promoters as defined in LeRoy et al. ((19); additional file 8). Loss of association of the IN ΔC versus the WT IN within 100 bp of chromatin sites bound by BET proteins was statistically different with P < 0.001 for both the total BET sites and those localized to specific promoters, respectively. Square bracket denotes inclusion of the limit, while parenthesis denotes exclusion.
Figure 5.
Figure 5.
Model for MLV integration. A. Assembly of BET proteins on acetylated histone tail (blue) in the presence of additional host factors and RNA Pol II (together marked as X) to TSS. MLV IN interacts with the ET domain of BET proteins through the IN TP (red) resulting in a preponderance of integrations near TSS. B. Loss of MLV IN TP results in loss of association with BET proteins and results in decreased targeting to BET binding sites and TSS.

References

    1. Fischer A., Hacein-Bey-Abina S., Cavazzana-Calvo M. Gene therapy of primary T cell immunodeficiencies. Gene. 2013;525:170–173. - PubMed
    1. Hacein-Bey-Abina S., Von Kalle C., Schmidt M., McCormack M.P., Wulffraat N., Leboulch P., Lim A., Osborne C.S., Pawliuk R., Morillon E., et al. LMO2-associated clonal T cell proliferation in two patients after gene therapy for SCID-X1. Science. 2003;302:415–419. - PubMed
    1. Wu X., Li Y., Crise B., Burgess S.M. Transcription start regions in the human genome are favored targets for MLV integration. Science. 2003;300:1749–1751. - PubMed
    1. Elis E., Ehrlich M., Prizan-Ravid A., Laham-Karam N., Bacharach E. p12 tethers the murine leukemia virus pre-integration complex to mitotic chromosomes. PLoS Pathog. 2012;8:e1003103. - PMC - PubMed
    1. Schneider W.M., Brzezinski J.D., Aiyer S., Malani N., Gyuricza M., Bushman F.D., Roth M.J. Viral DNA tethering domains complement replication-defective mutations in the p12 protein of MuLV Gag. Proc. Natl. Acad. Sci. U. S. A. 2013;110:9487–9492. - PMC - PubMed

Publication types

MeSH terms

Associated data