. 2014 Mar 25;111(12):4484-9.
doi: 10.1073/pnas.1319738111. Epub 2014 Mar 12.

Derivation of naive human embryonic stem cells

Affiliations

Derivation of naive human embryonic stem cells

Carol B Ware et al. Proc Natl Acad Sci U S A. .

Abstract

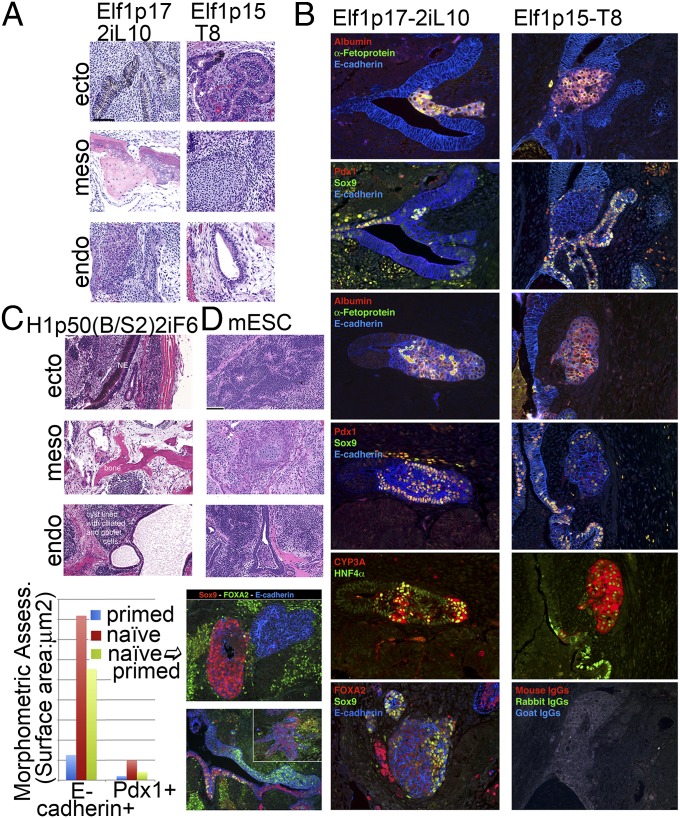
The naïve pluripotent state has been shown in mice to lead to broad and more robust developmental potential relative to primed mouse epiblast cells. The human naïve ES cell state has eluded derivation without the use of transgenes, and forced expression of OCT4, KLF4, and KLF2 allows maintenance of human cells in a naïve state [Hanna J, et al. (2010) Proc Natl Acad Sci USA 107(20):9222-9227]. We describe two routes to generate nontransgenic naïve human ES cells (hESCs). The first is by reverse toggling of preexisting primed hESC lines by preculture in the histone deacetylase inhibitors butyrate and suberoylanilide hydroxamic acid, followed by culture in MEK/ERK and GSK3 inhibitors (2i) with FGF2. The second route is by direct derivation from a human embryo in 2i with FGF2. We show that human naïve cells meet mouse criteria for the naïve state by growth characteristics, antibody labeling profile, gene expression, X-inactivation profile, mitochondrial morphology, microRNA profile and development in the context of teratomas. hESCs can exist in a naïve state without the need for transgenes. Direct derivation is an elusive, but attainable, process, leading to cells at the earliest stage of in vitro pluripotency described for humans. Reverse toggling of primed cells to naïve is efficient and reproducible.


Conflict of interest statement

The authors declare no conflict of interest.

Figures

Fig. 1.
Fig. 1.
Effect of 2i culture on mouse and human pluripotent cells. (A) Alkaline phosphatase stain of mouse pluripotent colonies. Left two plates: 2i added to mEpiSC colonies causes differentiation and loss of the alkaline phosphatase positive cells. Right four plates: mEpiSCs grown in butyrate plus SAHA for a minimum of 1 passage before addition of 2i allows pluripotent colonies to flourish. (B) hESC (H1) toggled backward on Matrigel to 2i through butyrate or forward to differentiation when not exposed to B/S before 2i culture, indicating that 2i must follow B/S exposure to prevent differentiation. (Scale bars, 100 μM.)
Fig. 2.
Fig. 2.
Genomic analysis of naïve hESCs. (A) RNA expression heat map of HIF2α (EPAS1) target genes in H1-2iF cells relative to parent H1 [H1p58(B/ST2)2iF14 vs. H1p58 in TeSR2; run in quadruplicate]. (B) Principal component analysis comparison of mouse whole genome Agilent array data comparing Hunter et al. (8) embryo data (Left) to mESC equivalents: R1p22 (mESC-2iL, naïve), mEpiSC7p24AF (mEpiSC-AF, primed), and mEpiSC7p55(AF7,B/S1)2iL20 (mEpiSC-2iL, toggled to naïve) (Right). Elf1 naïve (3iL, green squares) and primed (AF, blue squares) expression data are compared with the in vivo mouse embryo data in the plot on the left. (C) Comparison of in-house Elf1 expression array data as the standard against which to measure in-house (UW) data (H1-2iF × four repetitions; primed: H1 × four repetitions) and that generated by Hanna et al. (5). Naïve: C1.1, C1.2, WIBR3.1, WIBR3.3, WIBR3.5; primed: first grouping-BG01, BG01-mTeSR; BG01-NANOGtgk; second grouping-WIBR1, WIBR2, WIBR3rep1, WIBR3rep2, and WIBR3–5%O2. Note that the lines tested on left side that are compared with naïve Elf1 are grouped identically on the Elf1 primed side of the graph. Presumed naïve cell lines are represented by dark blue dots and presumed primed are orange. (D) DNase I hypersensitivity analysis of the POU5F1 enhancer regions for Elf1 (lower line black) and H1 (line above in blue). The first exon of POU5F1 is shown above the H1 data along with a 2-kb size bar to map the proximal enhancer (PE) and distal enhancer (DE). (E) ChIP-seq H3K27me3 comparison of primed hESCs [orange line, data taken from Gafni et al. (6)] to naïve Elf1-2iL (blue line) using the genes in C that intersect with Gene Ontogeny “developmental genes” (n = 648).
Fig. 3.
Fig. 3.
Analysis of hESC stages of pluripotency. (A) MicroRNA analysis associated with pluripotency. (B) XIST labeling shows that Elf1-3iLs (Left) do not display a XIST cloud by FISH, whereas Elf1s primed have two XIST signals and cells differentiated for 10 d (Right) gain a single XIST signal (red dot) within the nucleus. When the nucleus is highlighted using DAPI and the field magnified XIST remains undetectable in naïve Elf1 (Lower Left), whereas the XIST signal can be detected upon differentiation on one or both X chromosomes (red dots, white arrows, Lower Right two panels). (C) Bisulfite sequencing of the XIST promoter using the 11L-11R primers shows that XIST remains methylated throughout the naïve and primed stages. Using the 7L-7R primers, methylation seems to diminish in naïve relative to primed cells, 10-d in vitro-differentiated cells and in the 98-d teratoma. Note that the 1, 9, and 11 primer sets did not vary from data shown for set 11 upon differentiation. Open circles indicate unmethylated and filled circles indicate methylated CpGs. (D) Graphs representing cloning efficiency (percent) and doubling times (hours) of Elf1 naive (green), Elf1 primed (yellow), H1 naïve (dark blue), and H1 primed (light blue). (E) Electron microscopy of mitochondria. The left panels show the mitochondrial shape difference between Elf1-3iL and Elf1-AF. This is quantified in the graph on the right, where increased ratio indicates a rounder mitochondrial population (± SEM). ***P < 0.001, **P < 0.01, and *P < 0.05 as determined by t test.
Fig. 4.
Fig. 4.
Teratomas generated from naïve, naïve toggled to primed, and primed toggled to naïve cells reflect extensive endoderm developmental capacity. (A) H&E-labeled sections of Elf1p17-2iL10 (naïve; 42 d) and Elf1p15T8 (primed, 67 d) teratomas. (B) Endoderm-specific labeling of sections from the Elf1 teratomas shown in A. The upper two panels of both tumors are sequential sections, the upper labeled to highlight liver development (red, albumin; green, α-fetoprotein; and blue, E-cadherin) and the second set to highlight pancreatic development (red, PDX1; green, SOX9; and blue, E-cadherin). The next three panels (descending) for both tumors also represent different sequential sections with the first set representing liver development, the second set pancreatic development, and the third set liver development by alternative markers (labeled as above and red, CYP3A and green, HNF4A). The lower Elf1p17-2iL10 naïve panel are in place to reinforce the impression of the level of organization of endodermal development within these tumors (red, FOXA2; green, SOX9; and blue, E-cadherin), and the bottom right panel (Elf1p15T8) is a negative control. (C) H&E sections of an H1 naïve, 44-d teratoma. The graph below the H&E sections represents quantitation of the areas stained for either E-cadherin (epithelial cells) or PDX1 (pancreatic progenitors) in primed (H1p44-AF9), naïve [H1p49(B/S3)2iF10], and naïve reverted to primed [H1p49(B/S3, 2iF4)AF5] H1 generated teratomas, indicating that total epithelial developmental potential and the pancreatic subset are both enhanced in the naïve state relative to primed. (D) Top three panels are H&E sections of an mESC teratoma (naïve, 13 d). The lower panels show immunofluorescent labeling of sections from this mESC teratoma. (Scale bars in A and D, 100 μM; they define the scale for all H&E-stained sections.)

References

    1. Brons IG, et al. Derivation of pluripotent epiblast stem cells from mammalian embryos. Nature. 2007;448(7150):191–195. - PubMed
    1. Tesar PJ, et al. New cell lines from mouse epiblast share defining features with human embryonic stem cells. Nature. 2007;448(7150):196–199. - PubMed
    1. Ying QL, et al. The ground state of embryonic stem cell self-renewal. Nature. 2008;453(7194):519–523. - PMC - PubMed
    1. Nagy A, Rossant J, Nagy R, Abramow-Newerly W, Roder JC. Derivation of completely cell culture-derived mice from early-passage embryonic stem cells. Proc Natl Acad Sci USA. 1993;90(18):8424–8428. - PMC - PubMed
    1. Hanna J, et al. Human embryonic stem cells with biological and epigenetic characteristics similar to those of mouse ESCs. Proc Natl Acad Sci USA. 2010;107(20):9222–9227. - PMC - PubMed

Publication types