Review
. 2014 Mar 4:8:24.
doi: 10.3389/fnsys.2014.00024. eCollection 2014.

Impact of appetitive and aversive outcomes on brain responses: linking the animal and human literatures

Affiliations
Review

Impact of appetitive and aversive outcomes on brain responses: linking the animal and human literatures

Gregory B Bissonette et al. Front Syst Neurosci. .

Abstract

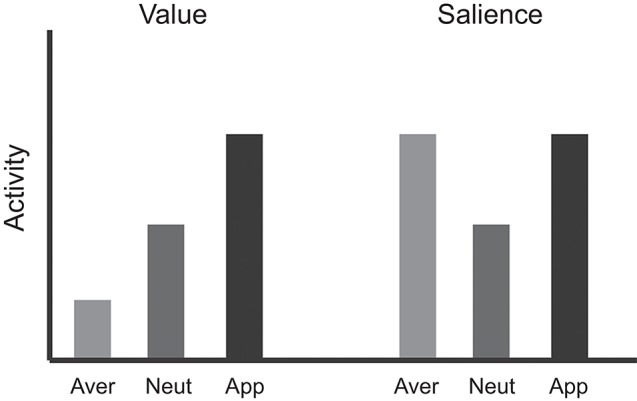
Decision-making is motivated by the possibility of obtaining reward and/or avoiding punishment. Though many have investigated behavior associated with appetitive or aversive outcomes, few have examined behaviors that rely on both. Fewer still have addressed questions related to how anticipated appetitive and aversive outcomes interact to alter neural signals related to expected value, motivation, and salience. Here we review recent rodent, monkey, and human research that address these issues. Further development of this area will be fundamental to understanding the etiology behind human psychiatric diseases and cultivating more effective treatments.

Keywords: appetitive and aversive outcomes; neural encoding; reward processing; salience; value encoding.


Figures

Figure 1
Figure 1
Logic used to dissociate “value” from other motivational variables. If activity in a region represents “value” signals, then activation in that region for appetitive stimuli is expected to be greater than aversive stimuli, with responses to neutral somewhere in between. However, if activity represents salience or intensity, activation during both appetitive and aversive stimuli would be greater than that observed to neutral stimuli.
Figure 2
Figure 2
Premotor and Orbitofrontal cortex encode motivation and value, respectively. Trials fell into three categories defined by reward-penalty combination: large reward (large reward and small penalty), neutral (small reward and small penalty), and large penalty (small reward and large penalty). (A) Performance measures sensitive to reward and penalty size. Penalty choice rate: trials on which the monkeys chose penalty expressed as a fraction of all trials on which they chose reward or penalty. Fixation break rate: trials terminated by a fixation break expressed as a percentage of all trials. Reaction time: average interval between fixation spot offset and saccade initiation on all trials in which the monkey made a saccade in the rewarded direction. Asterisks (all planned comparisons): statistically significant differences at P < 0.001. (B, C) Neuronal activity in OFC reflects the value conveyed by the incentive cues. (B) Shown are data from a single neuron firing during the cue period at a rate that was especially high for large reward and especially low for large penalty. (C) Mean firing rate as a function of time under the three incentive conditions for all 176 OFC neurons. (D, E) Neuronal activity in premotor (PM) reflects the motivational impact of the incentive cues. (D) Shown are data from a single neuron firing throughout the trial at a rate that was high for large reward and large penalty. (E) Mean firing rate as a function of time under the three incentive conditions for all 135 PM neurons. Adapted from Roesch and Olson (2004).
Figure 3
Figure 3
Ventral striatal neurons encode both value and motivation. Rats performed a task during which two odors indicated the size (large or small) of the reward to be delivered at the end of the trial. If an error was committed on large and small reward trials, no reward was delivered. A third odor indicated that a small reward would be delivered on correct trials and that quinine would be delivered when rats responded to the wrong well. (A) Average lick rate over time during recording sessions. Black = delivery of large reward; Dark gray = delivery of small reward when there was no risk; Light gray = delivery of small reward when there was a risk of quinine. Dashed gray = delivery of quinine on risk trials during which rats went to the wrong fluid well. Average percent correct for the three trial types. Average time taken to move from the odor port to the fluid well in response to the spatial cue lights. (B–C) Single cell example of neurons that exhibited firing patterns consistent with value and motivation encoding on correct trials for the 3 trial-types: large reward, small reward, and punishment. Activity is aligned to odor onset (left of dashed box) and reward delivery (right of dashed box). Inset: average waveform (not inverted). (D–E) Average normalized firing over all neurons that showed significant increases to both odor cues and reward delivery and those neurons that showed significant increased and decreased firing to cues and rewards, respectively. Firing rates were normalized by subtracting the baseline and dividing by the standard deviation. Ribbons represent standard error of the mean (SEM). Blue asterisks indicate significant differences between average firing during the odor epoch (gray bar) between large reward and small reward trials (blue versus yellow; t-test; p < 0.05). Red asterisks are the comparison between quinine punishment and small reward trials (red versus yellow; t-test; p < 0.05). The odor epoch did not include time when lights were on. Gray dashed = onset of odors. Black dashed = earliest possible time lights could turn on. Black arrow marks the average time of reward delivery. Adapted from Bissonette et al. (2013).
Figure 4
Figure 4
Dissociation of value and salience signals during a decision-making task. Human participants were shown pictures of food items that ranged from being highly disliked to highly liked and were asked to make a choice whether or not they would like to eat the item after the experiment (participants in fact consumed these items following scanning). For each picture, participants entered their response on one of the four choices: “Strong No (St. No)”, “No”, “Yes” or “Strong Yes (St. Yes)”. These four types of responses were used to define value and salience signals. The value regressor was defined based on the parametric weights [−2 −1 1 2] and the salience regressor was defined based on the parametric weights [2 1 1 2] corresponding to the four choices above (in that order). (A) Evidence for value type signals found in the medial OFC. (B) Evidence for both value and salience type signals found in the VS. Adapted from Litt et al. (2011).
Figure 5
Figure 5
Dissociation of value and salience signals during a reward processing task with humans. Each trial started with one of the six cue types: two levels of certainty (“certain”/“uncertain”) crossed with three levels of reward (“gain”/“neutral”/“loss”). After a variable delay period, a visual target appeared and participants pressed a button while the target was on the screen. The duration of the target was adjusted dynamically in each condition separately to maintain approximately 67% task performance. During “gain” trials participants could earn monetary reward; during “loss” trials participants could lose money; during “neutral” trials no win/loss occurred. During “certain” trials, outcomes were independent of performance, whereas during “uncertain” trials outcomes were based on performance. Value signals were found in the NAc when outcomes were “certain” (i.e., independent of performance) and evidence for salience signals were found when outcomes were “uncertain” (i.e., based on performance). Adapted from Cooper and Knutson (2008).
Figure 6
Figure 6
Prediction error (PE) signal analysis and potential confounds in fMRI analysis. (A) In a typical appetitive Pavlovian conditioning paradigm, one visual cue (CSneutral; not shown) is associated with no-reward (100% probability) whereas a second visual cue (CSreward) is associated with 50% probability of receiving reward. PE (i.e., actual minus expected outcomes) measured at the outcome phase of CSreward trials. (B) Simulated fMRI time series data (blue) generated using 10 reinforced and 10 unreinforced outcome events of CSreward trials in a pseudorandom order with 15 s separation between events at a typical TR of 2.5 s. For the sake of simplicity, we have not considered CSneutral trials and the cue phase of CSreward trials (which are typically modeled as separate regressors) and no noise was added to the simulated data. (C) When a single outcome phase regressor is used to account for variance during both reinforced and unreinforced outcomes of CSreward trials as typically done, the estimated regression coefficient would be somewhere midway between the activity evoked by reinforced and unreinforced outcomes, as demonstrated by the estimated data fit (red). (D) Hence, the residual time series data (green) will show positive values during reinforced outcome events and negative values during unreinforced outcome events. (E) Parametric regressor based on trial-by-trial fluctuations of PE values at the outcome phase of CSreward trials calculated using the Rescorla-Wagner rule (Rescorla and Wagner, 1972) (a learning rate of 0.25 was used as often used in fMRI studies). (F) The residual time series and the PE regressors are overlaid to show the high correlation between them. Because of this, unaccounted variance during the outcome phase related activity of CSreward trials could be “spuriously” accounted by the PE regressor.
Figure 7
Figure 7
Circuit diagram demonstrating connectivity between brain regions and their relative location on a sliding scale of value to salience, with the influence of DA signaling integrated. Gradient bars represent relative encoding of value and salience. Orbitofrontal Cortex—OFC, Prefrontal Cortex—PFC, Basolateral Amygdala—ABL, Anterior Cingulate Cortex—ACC, Parietal Cortex—Parietal, Dorsal Medial Striatum—DMS, Dorsal Lateral Striatum—DLS, Ventral Tegmental Area—VTA, Substantia Nigra compacta—SNc, Superior Colliculus—SC, GP—Globus Pallidus, Thalamus—Thal, Substantia Nigra reticulata—SNr, Premotor Cortex—PM.

References

    1. Adolphs R., Tranel D. (2000). “Emotion recognition and the human amygdala,” in The Amygdala: A Functional Anlysis, ed Aggleton J. P. (New York: Oxford University Press; ), 587–630
    1. Amemori K., Graybiel A. M. (2012). Localized microstimulation of primate pregenual cingulate cortex induces negative decision-making. Nat. Neurosci. 15, 776–785 10.1038/nn.3088 - DOI - PMC - PubMed
    1. Anderson A. K. (2005). Affective influences on the attentional dynamics supporting awareness. J. Exp. Psychol. Gen. 134, 258–281 10.1037/0096-3445.134.2.258 - DOI - PubMed
    1. Anderson A. K., Christoff K., Stappen I., Panitz D., Ghahremani D. G., Glover G., et al. (2003). Dissociated neural representations of intensity and valence in human olfaction. Nat. Neurosci. 6, 196–202 10.1038/nn1001 - DOI - PubMed
    1. Anderson B. A., Laurent P. A., Yantis S. (2011). Value-driven attentional capture. Proc. Natl. Acad. Sci. U S A 108, 10367–10371 10.1073/pnas.1104047108 - DOI - PMC - PubMed

LinkOut - more resources