

An in-silico model of lipoprotein metabolism and kinetics for the evaluation of targets and biomarkers in the reverse cholesterol transport pathway
- PMID: 24625468
- PMCID: PMC3952822
- DOI: 10.1371/journal.pcbi.1003509
An in-silico model of lipoprotein metabolism and kinetics for the evaluation of targets and biomarkers in the reverse cholesterol transport pathway
Erratum in
- PLoS Comput Biol. 2014 Nov;10(11):e1004001
Abstract
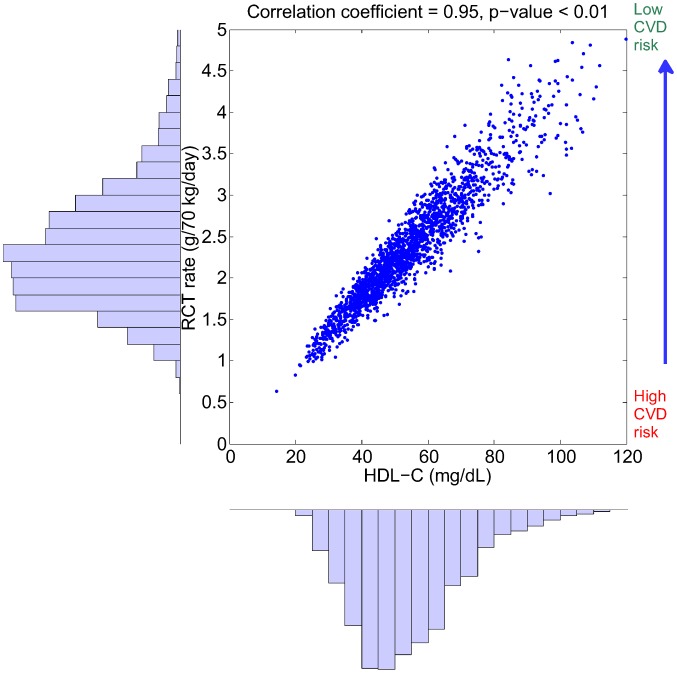
High-density lipoprotein (HDL) is believed to play an important role in lowering cardiovascular disease (CVD) risk by mediating the process of reverse cholesterol transport (RCT). Via RCT, excess cholesterol from peripheral tissues is carried back to the liver and hence should lead to the reduction of atherosclerotic plaques. The recent failures of HDL-cholesterol (HDL-C) raising therapies have initiated a re-examination of the link between CVD risk and the rate of RCT, and have brought into question whether all target modulations that raise HDL-C would be atheroprotective. To help address these issues, a novel in-silico model has been built to incorporate modern concepts of HDL biology, including: the geometric structure of HDL linking the core radius with the number of ApoA-I molecules on it, and the regeneration of lipid-poor ApoA-I from spherical HDL due to remodeling processes. The ODE model has been calibrated using data from the literature and validated by simulating additional experiments not used in the calibration. Using a virtual population, we show that the model provides possible explanations for a number of well-known relationships in cholesterol metabolism, including the epidemiological relationship between HDL-C and CVD risk and the correlations between some HDL-related lipoprotein markers. In particular, the model has been used to explore two HDL-C raising target modulations, Cholesteryl Ester Transfer Protein (CETP) inhibition and ATP-binding cassette transporter member 1 (ABCA1) up-regulation. It predicts that while CETP inhibition would not result in an increased RCT rate, ABCA1 up-regulation should increase both HDL-C and RCT rate. Furthermore, the model predicts the two target modulations result in distinct changes in the lipoprotein measures. Finally, the model also allows for an evaluation of two candidate biomarkers for in-vivo whole-body ABCA1 activity: the absolute concentration and the % lipid-poor ApoA-I. These findings illustrate the potential utility of the model in drug development.
Conflict of interest statement
I have read the journal's policy and have the following conflicts: JL and NAM are employees of F. Hoffmann-La Roche; JL and NAM have stock ownership of F. Hoffmann-La Roche. KH, MNN and EAB declare no competing interest.
Figures
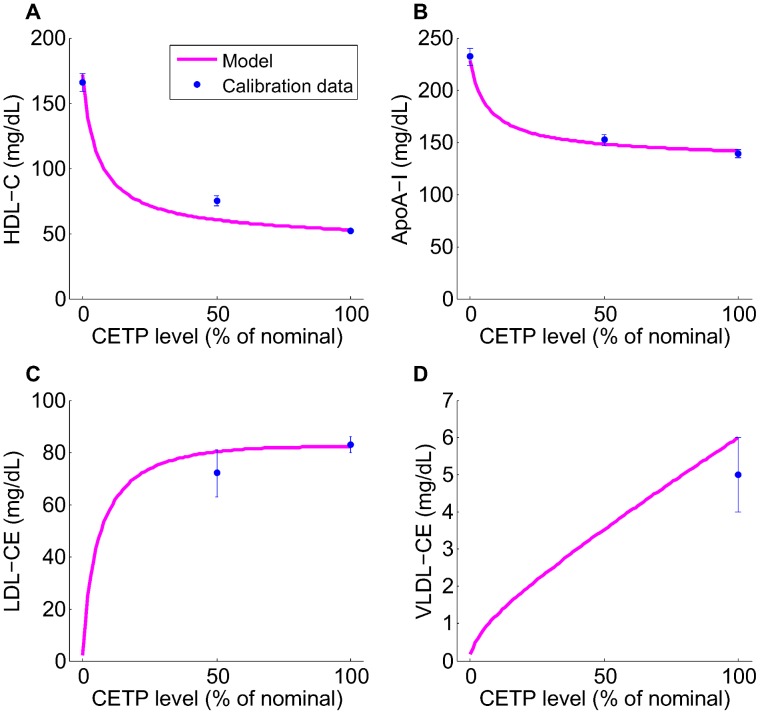
 from 100% to 0% of those corresponding to the nominal subject.
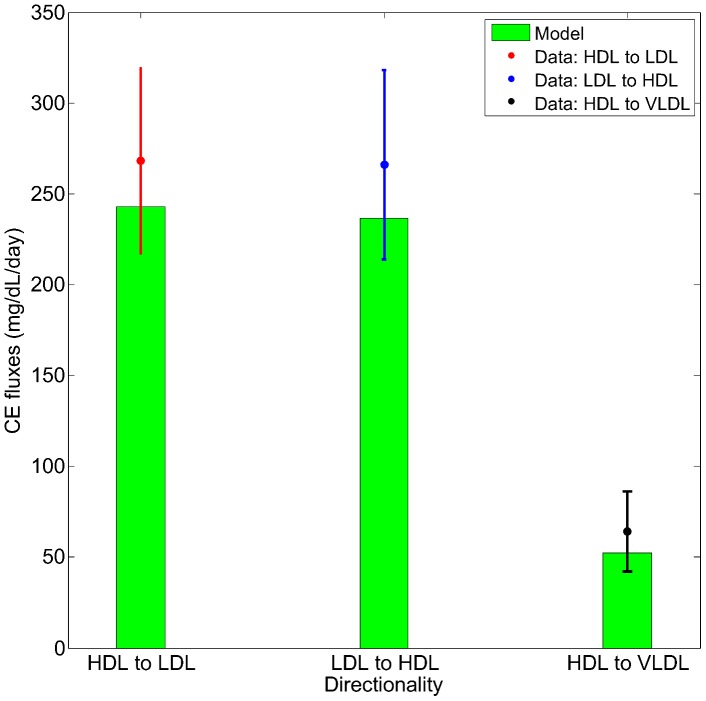

 and
and  to 50% and 0% of the nominal values respectively.
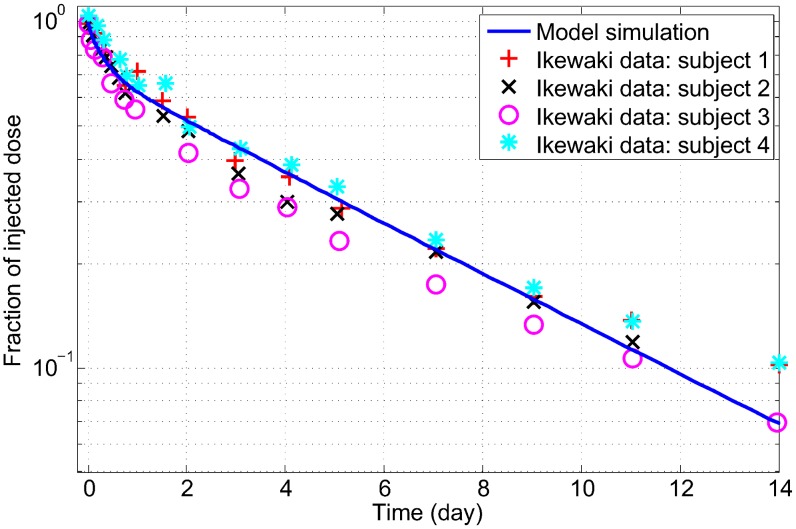

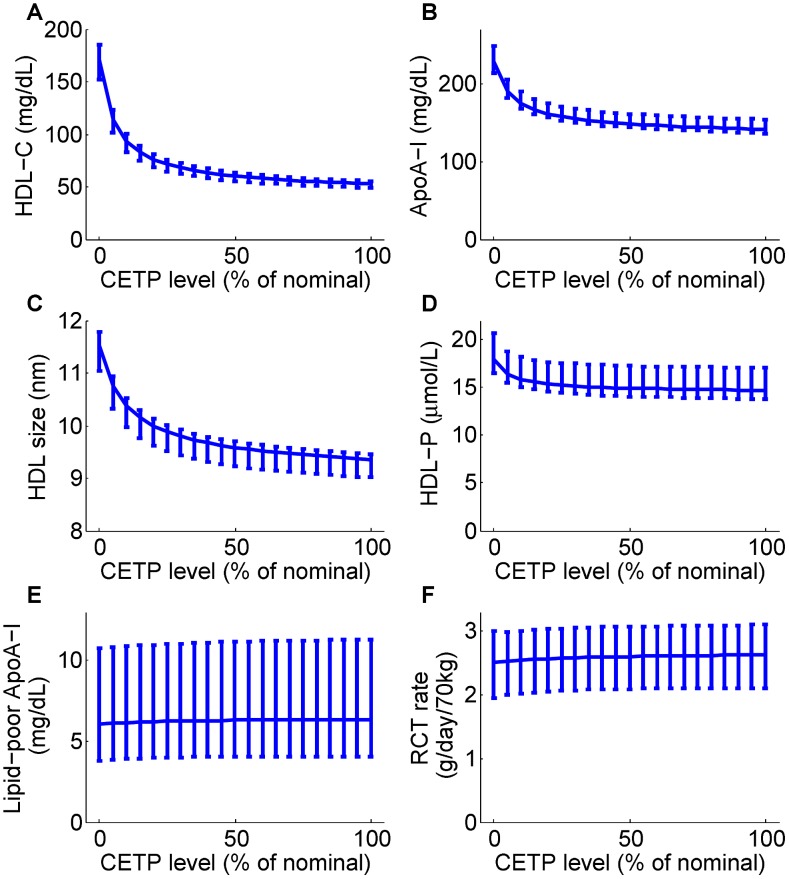
 from 100% to 0% of those corresponding to the nominal subject. For each prediction, the mean and the 95% confidence intervals are plotted.
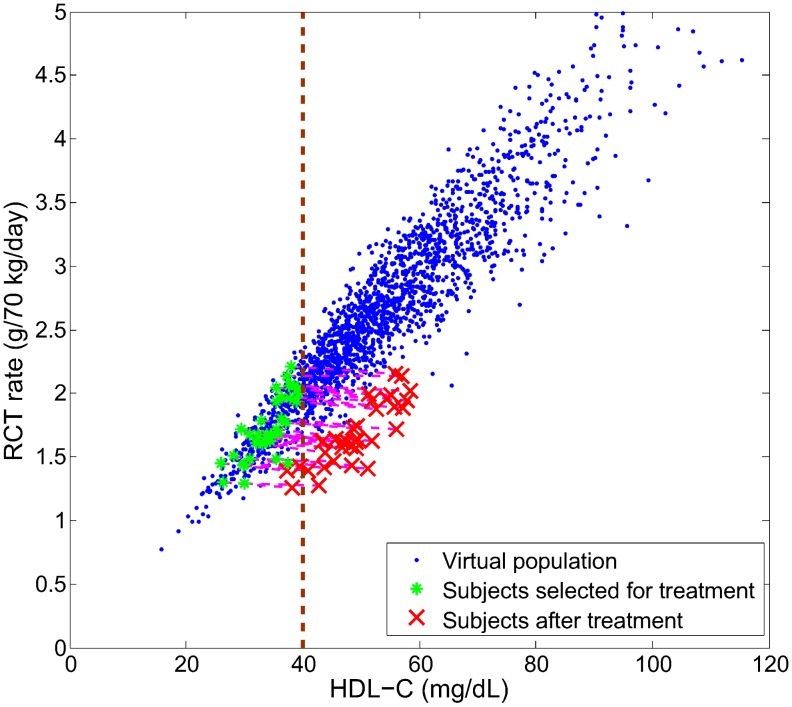
 and
and  decreased to 20% of their original values.
 from 100% to 300% of the nominal subject. For each prediction, the mean and the 95% confidence intervals are plotted.
 ) increased by 100% of its initial value.
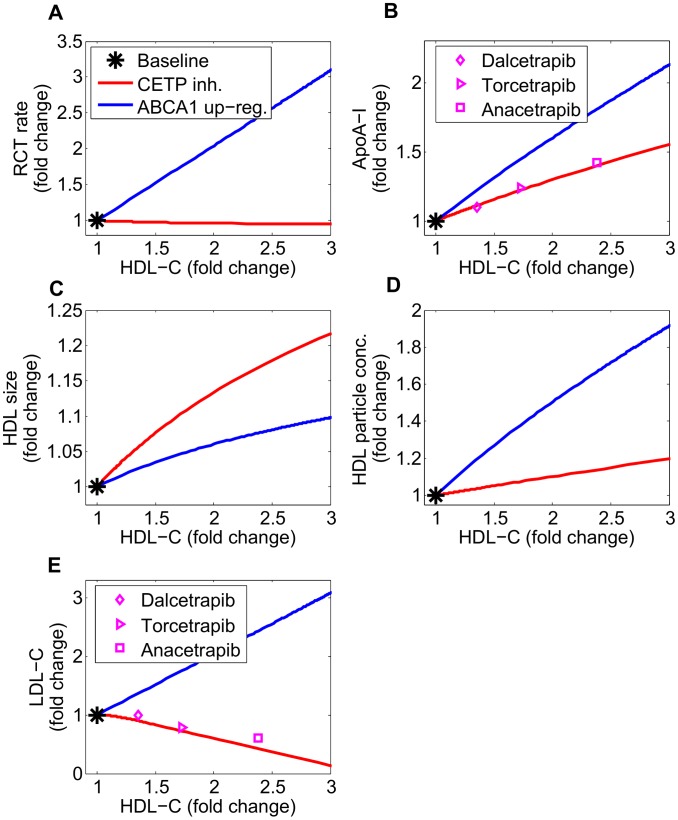

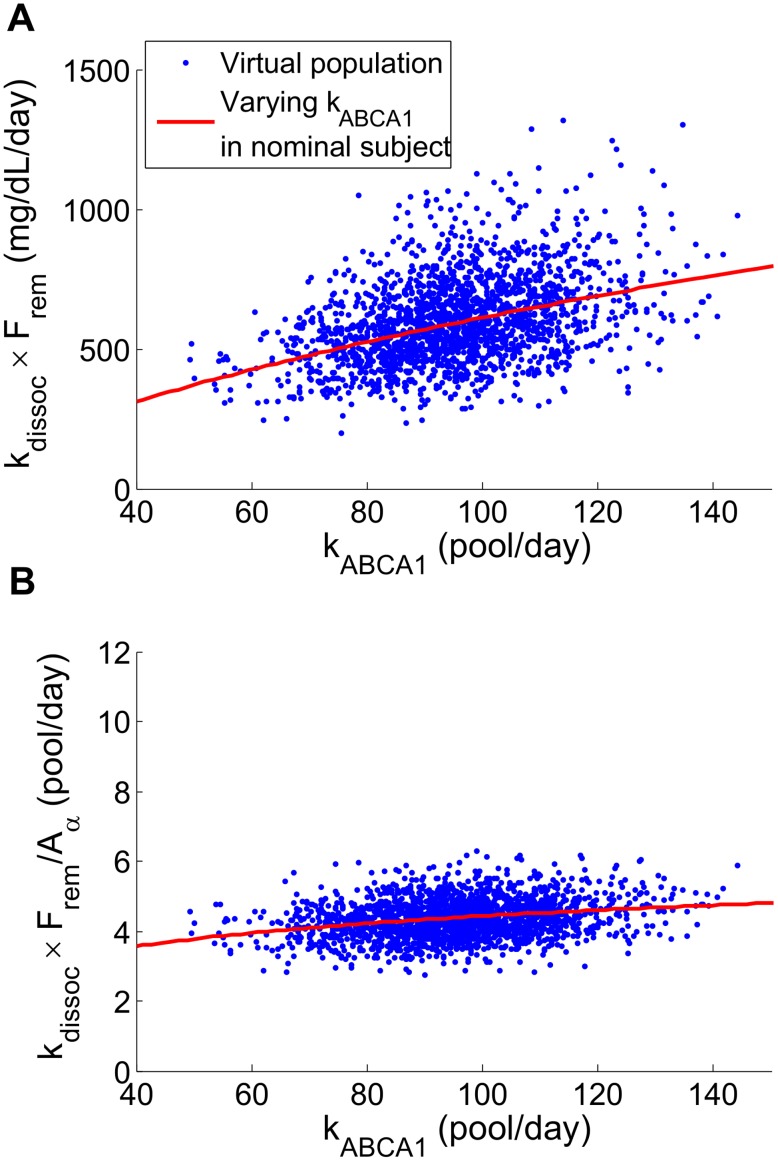
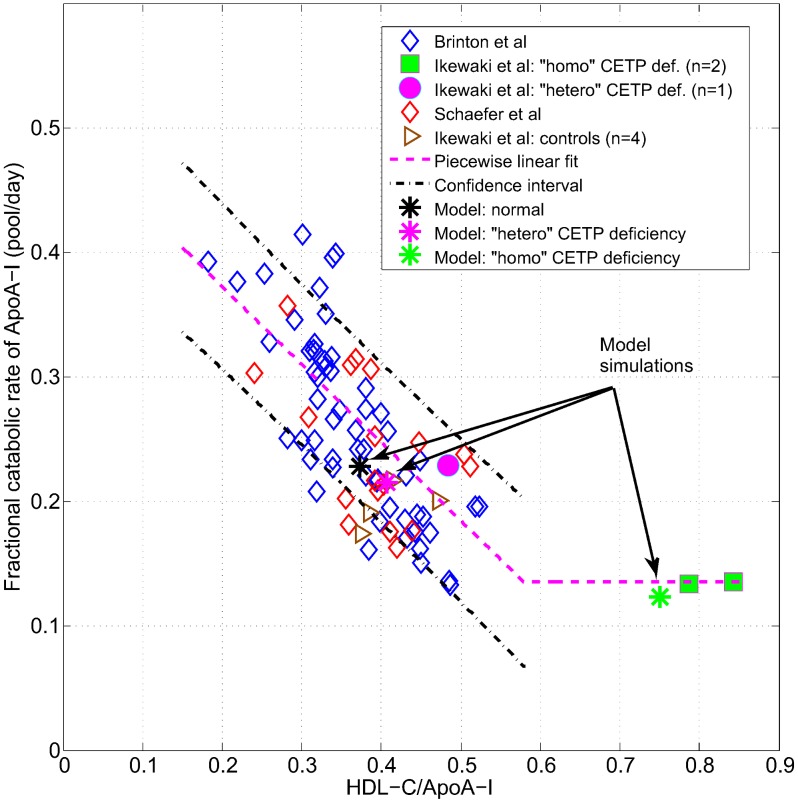
 . The simulations of the nominal subject with only the parameter
  varied are shown as solid lines.
References
-
- Hersberger M, von Eckardstein A (2005) Modulation of high-density lipoprotein cholesterol metabolism and reverse cholesterol transport. Handb Exp Pharmacol 170: 537–561. - PubMed
-
- Barter PJ, Caulfield M, Eriksson M, Grundy SM, Kastelein JJ, et al. (2007) Effects of torcetrapib in patients at high risk for coronary events. N Engl J Med 357: 2109–2122. - PubMed
Publication types
MeSH terms
Substances
LinkOut - more resources
Full Text Sources
Other Literature Sources
Medical
