. 2014 Mar 13;9(3):e90524.
doi: 10.1371/journal.pone.0090524. eCollection 2014.

MicroRNA-dependent regulation of transcription in non-small cell lung cancer

Affiliations

MicroRNA-dependent regulation of transcription in non-small cell lung cancer

Sonia Molina-Pinelo et al. PLoS One. .

Abstract

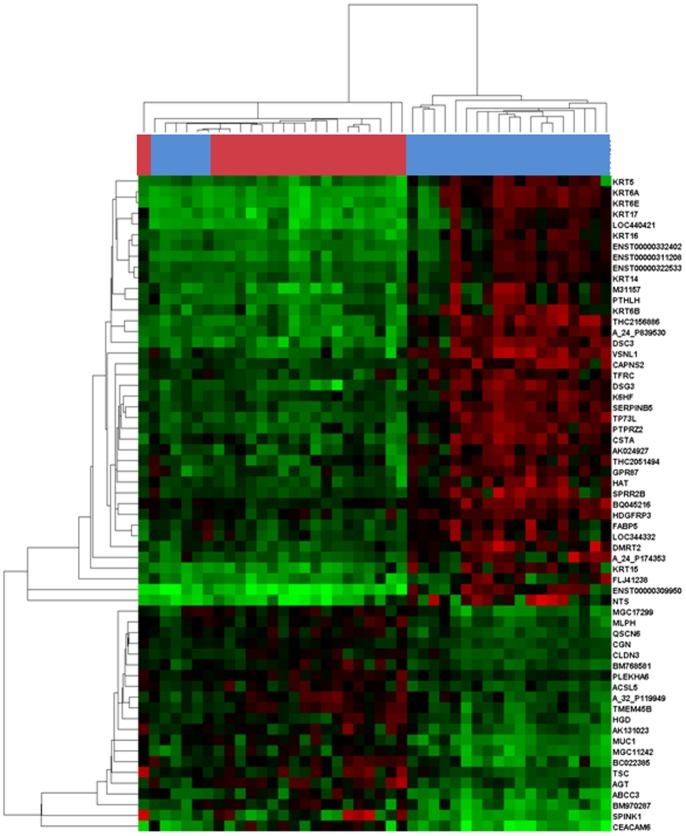
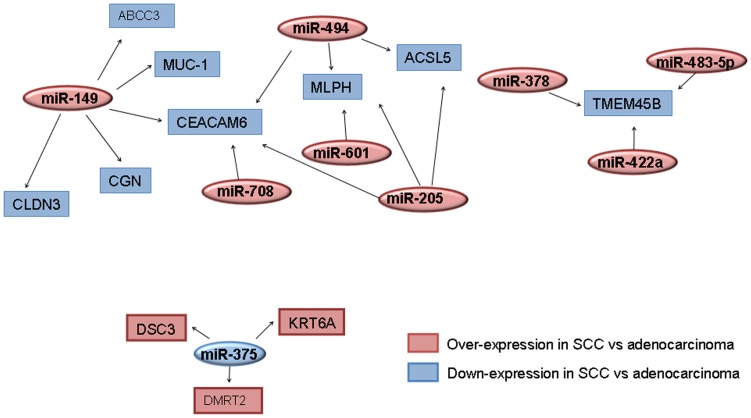
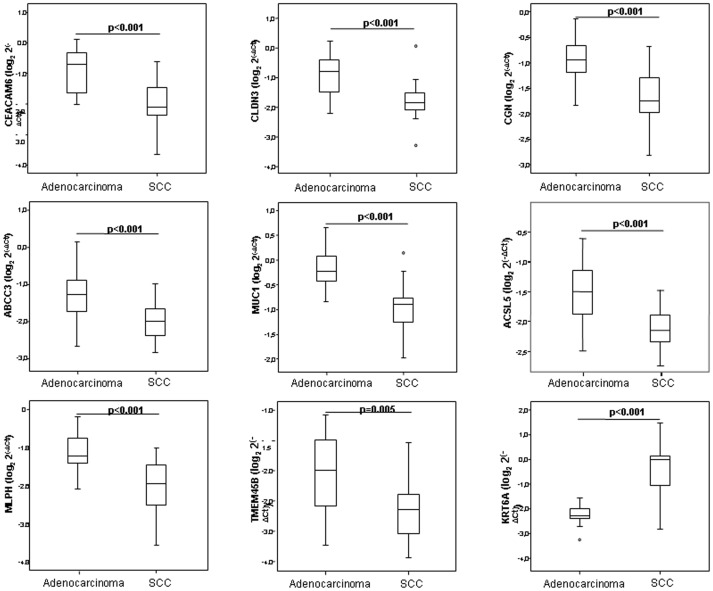
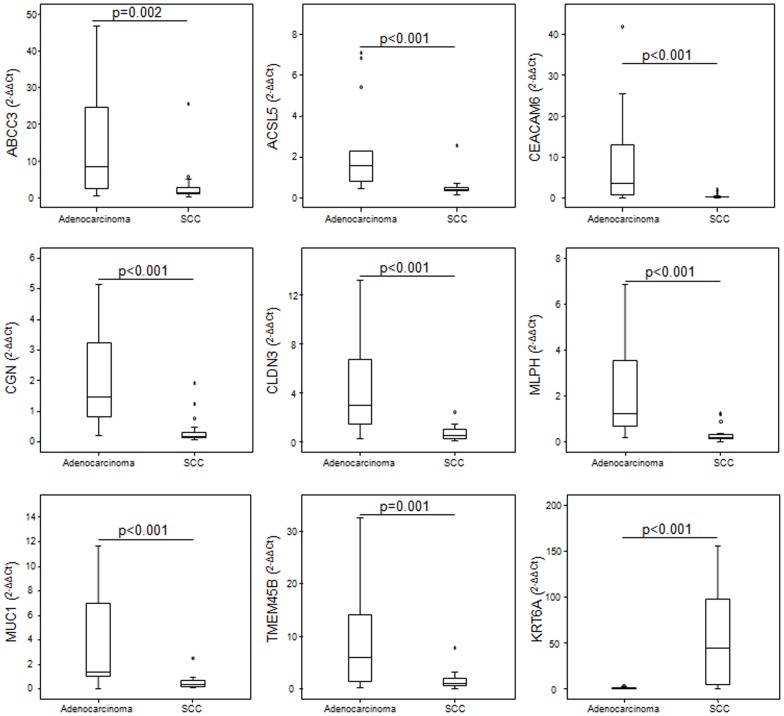
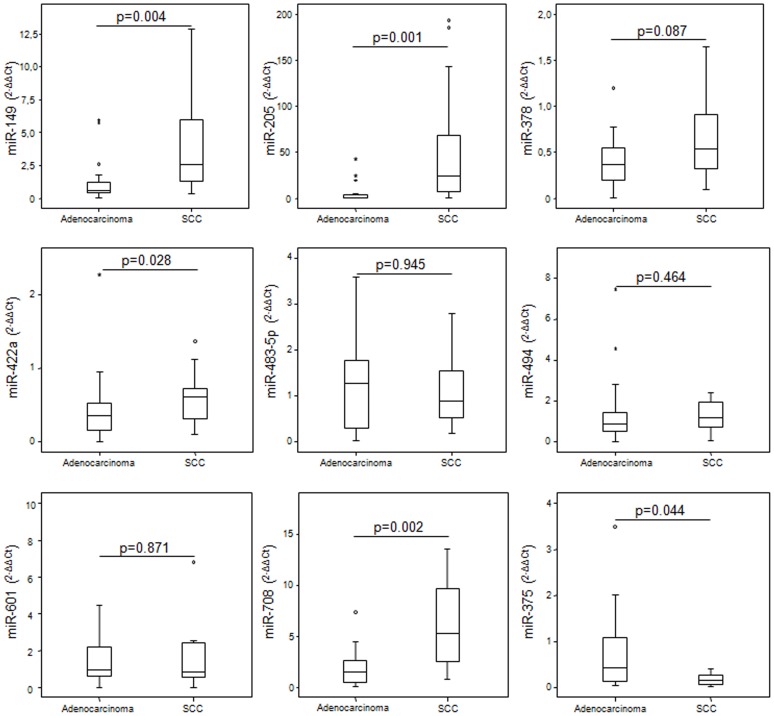
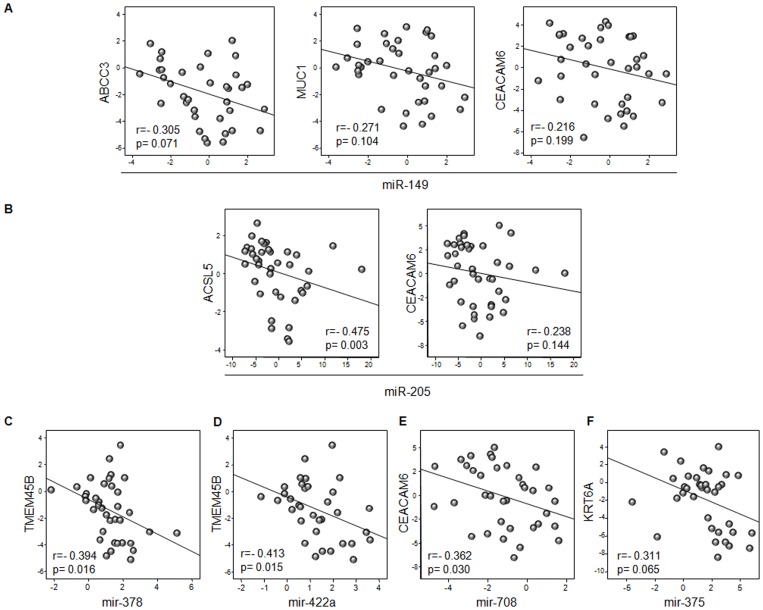
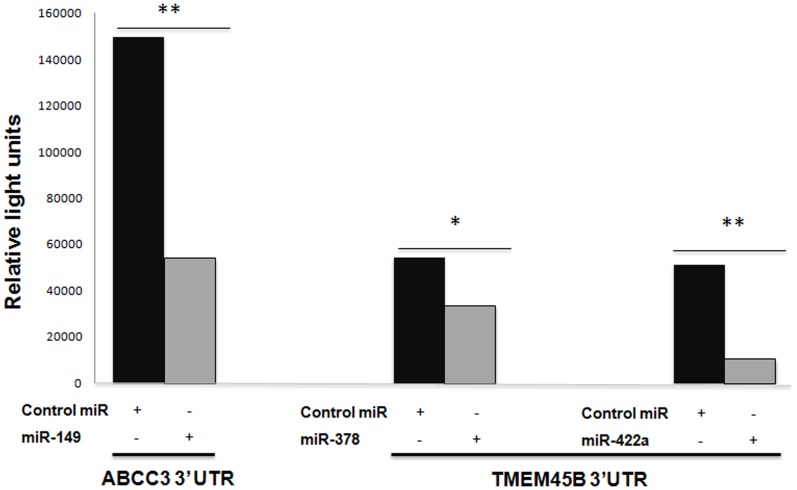
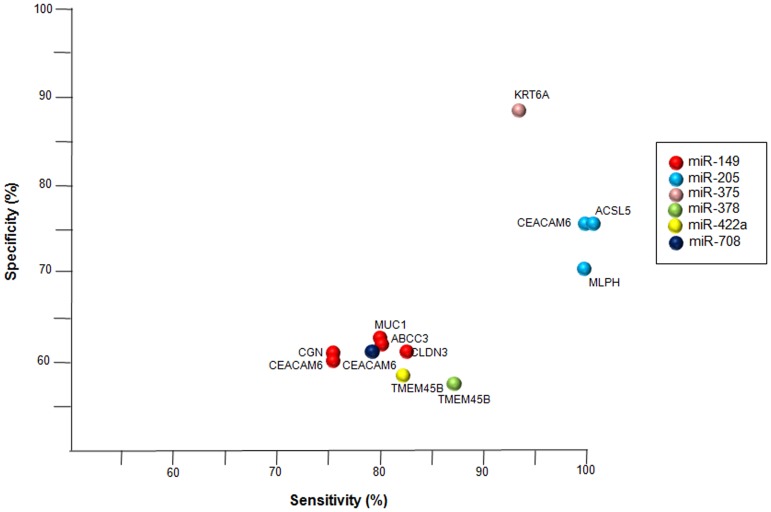
Squamous cell lung cancer (SCC) and adenocarcinoma are the most common histological subtypes of non-small cell lung cancer (NSCLC), and have been traditionally managed in the clinic as a single entity. Increasing evidence, however, illustrates the biological diversity of these two histological subgroups of lung cancer, and supports the need to improve our understanding of the molecular basis beyond the different phenotypes if we aim to develop more specific and individualized targeted therapy. The purpose of this study was to identify microRNA (miRNA)-dependent transcriptional regulation differences between SCC and adenocarcinoma histological lung cancer subtypes. In this work, paired miRNA (667 miRNAs by TaqMan Low Density Arrays (TLDA)) and mRNA profiling (Whole Genome 44 K array G112A, Agilent) was performed in tumor samples of 44 NSCLC patients. Nine miRNAs and 56 mRNAs were found to be differentially expressed in SCC versus adenocarcinoma samples. Eleven of these 56 mRNA were predicted as targets of the miRNAs identified to be differently expressed in these two histological conditions. Of them, 6 miRNAs (miR-149, miR-205, miR-375, miR-378, miR-422a and miR-708) and 9 target genes (CEACAM6, CGN, CLDN3, ABCC3, MLPH, ACSL5, TMEM45B, MUC1) were validated by quantitative PCR in an independent cohort of 41 lung cancer patients. Furthermore, the inverse correlation between mRNAs and microRNAs expression was also validated. These results suggest miRNA-dependent transcriptional regulation differences play an important role in determining key hallmarks of NSCLC, and may provide new biomarkers for personalized treatment strategies.


Conflict of interest statement

Competing Interests: The authors have declared that no competing interests exist.

Figures

Figure 1
Figure 1. Distinct transcriptional profiles of SCC and adenocarcinoma histological subtypes.
The Prediction Analysis of Microarray algorithm identified 61 genes that defined a molecular signature for each histological subtype. The modulators’ dendrogram represents an unsupervised hierarchical clustering analysis of 19 adenocarcinoma and 25 SCC based on their gene expression profile. The heat map was color coded using red for up-regulation and green for down-regulation from a lung cancer reference pool. On the top of the heap map, colours correspond to gene expression profiles of SCC samples (blue) versus adenocarcinoma samples (red).
Figure 2
Figure 2. MicroRNA-mRNA target networks.
The graph shows the transcriptional targets of differently expressed miRNAs in SCC and adenocarcinoma tumor types using three web databases of miRNA target prediction (miRANDA, TargetScan and miRWalk). The default colour scheme used to represent expression level is red/blue (red for over-expression of mRNAs or miRNAs in SCC versus adenocarcinoma and blue for down-expression of mRNAs or miRNAs in SCC versus adenocarcinoma). The arrows indicate mRNA repression by the connected miRNAs. Squares represent deregulated mRNAs and ovals represent differentially expressed miRNAs in lung adenocarcinoma and SCC.
Figure 3
Figure 3. Experimental validation of deregulated mRNA in the training cohort.
To validate genes identified as differentially expressed by tumor histology in the microarray data, relative expression levels of mRNAs were quantified by real-time PCR using the ΔCt method by B2M as housekeeping gene. The plots show median ΔCt values of validated genes in patients with adenocarcinoma versus SCC. Data derived from RT-qPCR are presented as log2 2−ΔCt values. P value below 0.05 was considered significant.
Figure 4
Figure 4. Validation of deregulated mRNA in an independent cohort.
Expression of nine mRNAs was validated by real-time PCR in an independent cohort of NSCLC patients. mRNA expression levels were determined in tumor samples and paired normal lung tissue from lung cancer patients and relative expression by histological subtype was assessed. Median ΔΔCt values were determined in the validated genes in patients with adenocarcinoma and SCC. Data derived from RT-qPCR are presented as 2−ΔΔCt values. P value below 0.05 was considered significant.
Figure 5
Figure 5. Relative quantification of deregulated microRNAs in the independent validation cohort.
Expression of deregulated miRNAs was evaluated in the validation cohort. MicroRNA expression levels were determined in tumor and paired normal lung tissue of lung cancer patients and relative expression by histological subtype was assessed. Median ΔΔCt values were determined in nine miRNAs in patients with adenocarcinoma versus SCC. Data derived from RT-qPCR are presented as 2−ΔΔCt values. P value below 0.05 was considered significant.
Figure 6
Figure 6. Spearman’s correlation between miRNA and target gene expression in patients with lung adenocarcinoma or squamous cell carcinoma.
Expression of the 6 validated miRNAs and that of their putative target genes was measured in each patient in the validation cohort. The significance of the inverse association between each of these miRNA/mRNA couples was assessed by the Spearman’s correlation coefficient. P values less than 0.05 were considered statistically significant. A) Relationships between ABCC3, MUC1 and CEACAM6 with miR-149. B) Relationships between ACSL5 and CEACAM6 with miR-205. C) Relationship between TMEM45B and miR-378. D) Relationship between TMEM45B and miR-422a. E) Relationship between CEACAM6 and miR-7018. F) Relationship between KRT6A and miR-miR-175.
Figure 7
Figure 7. 3′-UTR reporter assay for miR target validation.
HEK 293 cells were transfected with luciferase reporter vector containing the 3′ UTR region of ABCC3 and TMEM45B. Reporter vectors were co-transfected with a miRN mimic or control miRN mimic. Following 24 h incubation, luciferase activity was measured. *p<0.05 and **p<0.001 by t-test.
Figure 8
Figure 8. Sensitivity and Specificity of miRNA-mRNA target networks.
Plot showing specificity and sensitivity of validated miRNAs in combination with predicted mRNAs to discriminate between SCC and adenocarcinoma. The colours represent down-regulated mRNA from six deregulated miRNAs in SCC or adenocarcinoma.

References

    1. Siegel R, Ward E, Brawley O, Jemal A (2011) Cancer statistics, 2011: The impact of eliminating socioeconomic and racial disparities on premature cancer deaths. CA Cancer J Clin 61: 212–236. - PubMed
    1. Minna JD, Roth JA, Gazdar AF (2002) Focus on lung cancer. Cancer Cell 1: 49–52. - PubMed
    1. Wistuba II (2007) Genetics of preneoplasia: lessons from lung cancer. Curr Mol Med 7: 3–14. - PubMed
    1. Petersen I, Bujard M, Petersen S, Wolf G, Goeze A, et al. (1997) Patterns of chromosomal imbalances in adenocarcinoma and squamous cell carcinoma of the lung. Cancer Res 57: 2331–2335. - PubMed
    1. Kayser G, Csanadi A, Otto C, Plönes T, Bittermann N, et al. (2013) Simultaneous multi-antibody staining in non-small cell lung cancer strengthens diagnostic accuracy especially in small tissue samples. PLoS One 8: e56333. - PMC - PubMed

Publication types

MeSH terms