. 2014 Mar 28;343(6178):1249288.
doi: 10.1126/science.1249288. Epub 2014 Mar 13.

Microbiota-dependent crosstalk between macrophages and ILC3 promotes intestinal homeostasis

Affiliations

Microbiota-dependent crosstalk between macrophages and ILC3 promotes intestinal homeostasis

Arthur Mortha et al. Science. .

Abstract

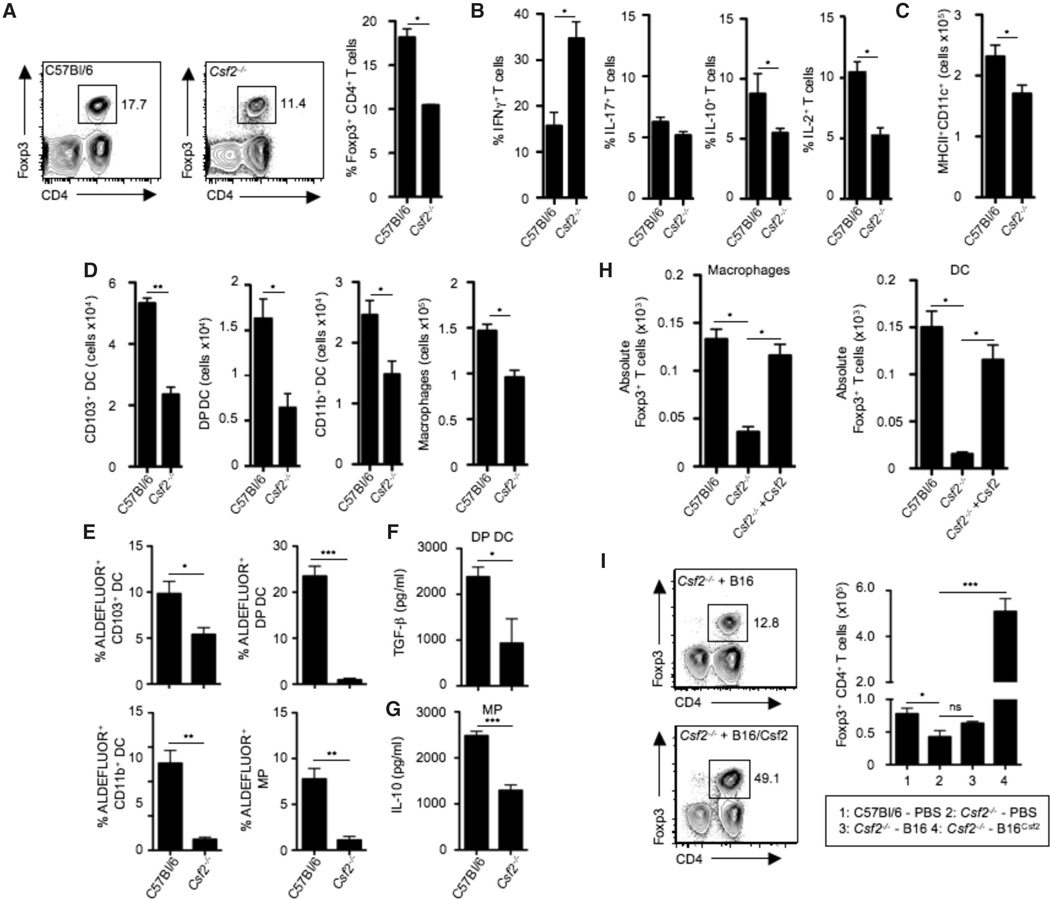
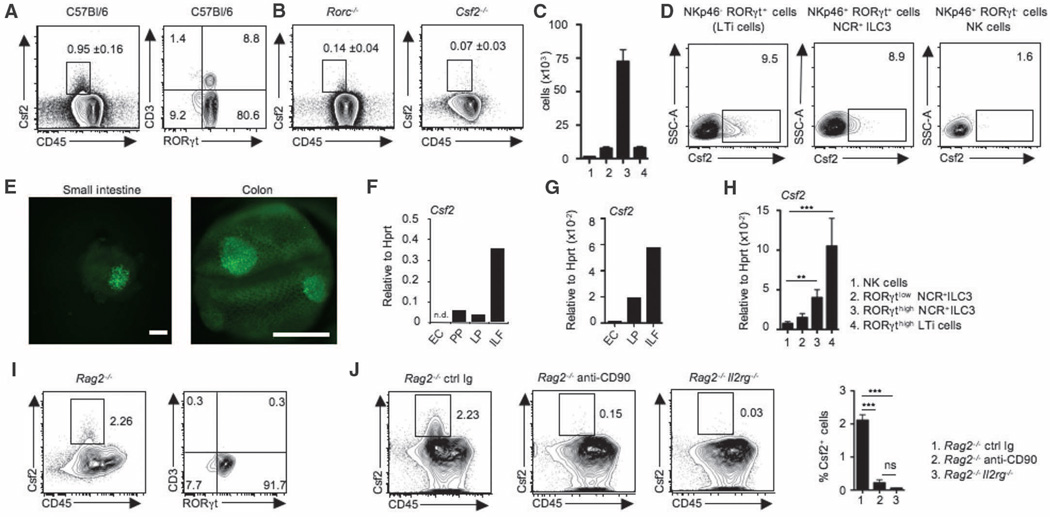
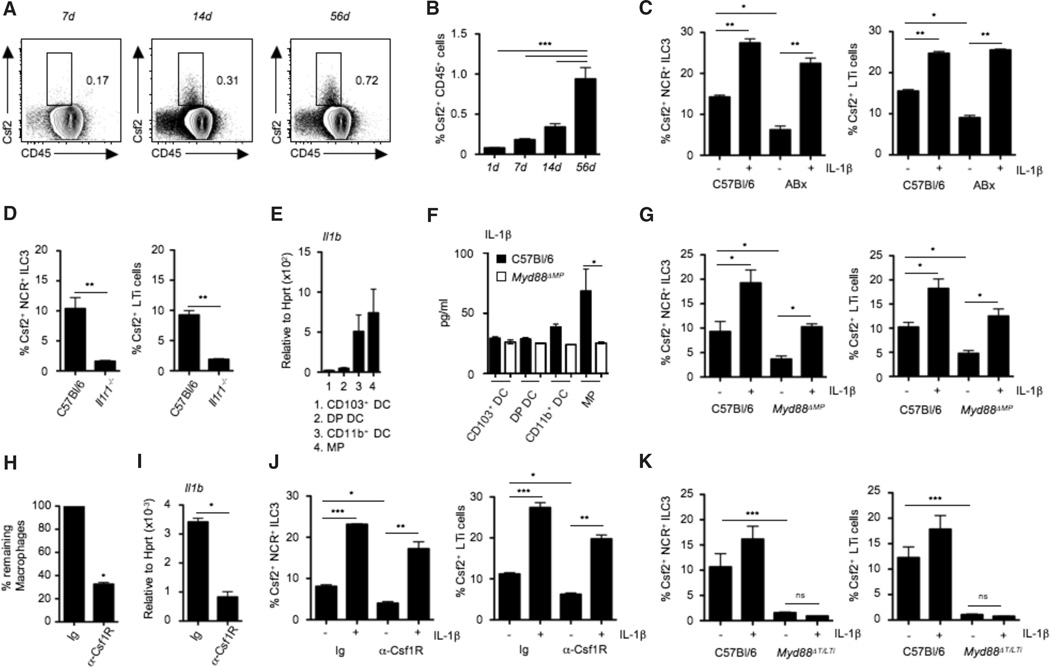
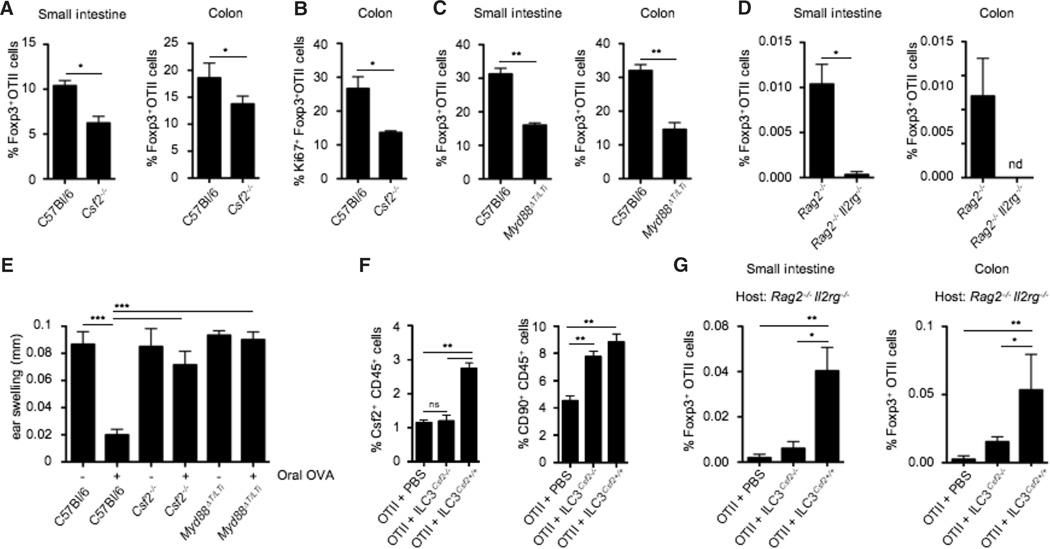
The intestinal microbiota and tissue-resident myeloid cells promote immune responses that maintain intestinal homeostasis in the host. However, the cellular cues that translate microbial signals into intestinal homeostasis remain unclear. Here, we show that deficient granulocyte-macrophage colony-stimulating factor (GM-CSF) production altered mononuclear phagocyte effector functions and led to reduced regulatory T cell (T(reg)) numbers and impaired oral tolerance. We observed that RORγt(+) innate lymphoid cells (ILCs) are the primary source of GM-CSF in the gut and that ILC-driven GM-CSF production was dependent on the ability of macrophages to sense microbial signals and produce interleukin-1β. Our findings reveal that commensal microbes promote a crosstalk between innate myeloid and lymphoid cells that leads to immune homeostasis in the intestine.


Figures

Fig. 1
Fig. 1. Csf2 regulates tissue mononuclear phagocyte frequency and effector functions required for T helper cell homeostasis
(A) Contour plots and bar graph show percentages of CD3+CD4+Foxp3+ colonic Tregs among total colonic lamina propria CD45+ cells in C57Bl/6 and Csf2−/− mice. (B) Bar graphs show percentages of CD3+CD4+ T cells producing IFN-γ, IL-17, IL-10, or IL-2 among total colonic CD45+ cells in C57Bl/6 and Csf2−/− mice after 4 hours of stimulation with phorbol 12-myristate 13-acetate (PMA)–ionomycin in the presence of Brefeldin A. (C) Bar graphs show absolute numbers of MHCII+CD11c+ cells among total colonic CD45+ cells in C57Bl/6 and Csf2−/− mice. (D) DCs were characterized as CD45+MHCII+CD11c+ and further subdivided into CD103+ DCs, CD103+CD11b+ DCs [double positive (DP) DCs], and CD11b+ DCs. Macrophages (MP) were characterized as MHCII+CD11c+CD11b+F4/80+CD64+ cells. Bar graphs show absolute numbers of CD103+ DCs, DP DCs, CD11b+ DCs, and MPs in C57Bl/6 and Csf2−/− mice. (E) Percentages of ALDEFLUOR+ cells among each colonic DC subset and MPs in C57Bl/6 and Csf2−/− mice. (F and G) Bar graphs show enzyme-linked immunosorbent assay (ELISA) measurement of TGF-β production by sorted DP DCs (F) and IL-10 production by sorted MPs (G). (H) Colonic MPs or DCs were FACS-sorted from C57BI/6 or Csf2−/− mice and cocultured with naïve T cells alone or in the presence of exogenous Csf2. Bar graphs show absolute numbers of Foxp3+ Tregs. Data are representative of six independent experiments and are shown as mean ± SD. (I) Contour plots show percentages of CD45+CD3+CD4+Foxp3+ colonic Tregs in Csf2−/− mice 12 to 14 days after injection with B16 melanoma cells or B16 cells overexpressing Csf2 (B16Csf2). Bar graphs show absolute number of colonic Tregs in the indicated groups. All data (A to H) are shown as mean ± SD of three independent experiment with at least three mice per experiment. Student’s t test (A to F) and one-way analysis of variance (ANOVA) Bonferroni’s multiple comparison test (H and I) were performed. Statistical significance is indicated by *P < 0.05, **P < 0.01, ***P < 0.001; ns, not significant.
Fig. 2
Fig. 2. RORγt+ ILCs are the major source of Csf2 in the steady-state gut
(A) FACS plots show Csf2 and CD45 expression in lamina propria cells and expression of CD3 and RORγt among gated Csf2+CD45+ lamina propria cells (data shown are representative of 10 independent experiments including at least 5 mice per experiment). Staining was performed on ex vivo isolated cells cultured for 4 hours in the presence of Brefeldin A. (B) FACS plots show percentage Csf2+CD45+ lamina propria cells in the small intestine of Rorc−/− and Csf2−/− mice. Data are representative of at least three experiments with two mice per group and are shown as mean ± SD. (C) Bar graph shows absolute numbers of Csf2-producing cells in lamina propria cells. 1: Csf2+CD3+RORγt T cells; 2: Csf2+CD3+RORγt+ T cells; 3: Csf2+CD3RORγt+ ILCs; 4: Csf2+CD3RORγt cells. (D) FACS plots show Csf2 expression on gated lamina propria NKp46RORγt+ LTi cells, NKp46+RORγt+ NCR+ ILC3, and NKp46+RORγt NK cells. Data are representative of six independent experiments with at least three mice per group. (E) Representative fluorescence stereomicroscopic photographs of live lamina propria biopsy punches obtained from Rorc+/EGFP mice. Image shows clustered enhanced green fluorescent protein (EGFP) (RORγt) expression of ILF-residing Rorc+/EGFP cells isolated from small intestine (left; scale bar: 100 µm) and colon (right; scale bar: 500 µm). (F and G) Quantitative reverse transcription–polymerase chain reaction (RT-PCR) analysis of Csf2 expression in isolated intestinal epithelial cells (EC), Peyer’s patches (PP), lamina propria depleted of ILFs (LP), and ILF from small intestine (F) or colon (G). Data are representative of at least two independent experiments with three mice per group. (H) Quantitative RT-PCR analysis of Csf2 expression in colonic NK cells (1), RORγtlo NCR+ ILC3 (2), RORγthigh NCR+ ILC3 (3), and RORγthigh LTi cells (4) isolated from Rorc+/EGFP mice. (I) FACS plots show Csf2 and CD45 staining on total colonic lamina propria cells and expression of CD3 and RORγt among Csf2+CD45+ cells isolated from Rag2−/− mice (data are representative of two independent experiments with three mice per group). (J) FACS plots show Csf2 and CD45 staining on total colonic lamina propria cells isolated from either Rag2−/− mice, Rag2−/− mice injected with depleting anti-CD90 mAb, or Rag2−/−Il2rg−/− mice. Bar graph shows percentages of Csf2+ CD45+ cells in each group of mice. All Csf2 staining was performed on ex vivo isolated cells cultured for 4 hours in the presence of Brefeldin A. Data are shown as mean ± SD of two independent experiments with three mice per group. One-way ANOVA Bonferroni’s multiple comparison test (H and J) was performed. Statistical significance is indicated by *P < 0.05, **P < 0.01, and ***P < 0.001.
Fig. 3
Fig. 3. Microbiota-driven IL-1β release by intestinal macrophages regulates Csf2 production by RORγt+ ILC3
(A) FACS plot showing Csf2 expression in whole intestinal lamina propria CD45+ cells at the indicated time points after birth. (B) Bar graph shows percentages of Csf2+ cells among total lamina propria cells in mice at the indicated time points after birth. Data shown are the results of three independent experiments with at least three mice per group. (C) Percentages of Csf2+ cells among gated colonic lamina propria NCR+ ILC3 and LTi cells in conventional mice or mice treated with broad-spectrum antibiotics (ABx). Stains were performed on cells cultured for 4 hours with (+) or without (−) IL-1β in the presence of Brefeldin A. Data are shown as mean ± SD of three independent experiments with at least three mice per group. (D) Percentages of Csf2+ cells among gated colonic lamina propria NCR+ILC3 and LTi cells in Il1r−/− or C57Bl/6 mice. Data show the results of two independent experiments with three mice per group. (E) Il1b mRNA expression in FACS-purified colonic MNPs. Data shown are representative of two independent experiments with pooled cells of three mice. (F) IL-1β protein production by purified intestinal DC subsets and MPs isolated from the colonic lamina propria of C57Bl/6 and Myd88ΔMP mice, measured by ELISA after 24 hours of culture in complete medium. Data are representative of two independent experiments with pooled cells of three mice. (G) Percentages of Csf2+ cells among gated colonic ILC3 in Myd88ΔMP mice. Stains were performed in cells cultured for 4 hours with or without IL-1β in the presence of Brefeldin A. Data are shown as mean ± SD of three independent experiments with at least three mice per group. (H) Groups of mice were injected with one injection of anti-Csf1R mAb (3 mg per mouse) or control mAb. Bar graph shows percentages of remaining macrophages in colonic tissue. (I) Il1b expression in whole colonic tissue of mice treated with anti-Csf1R mAb or isotype control. Data are shown as mean ± SD of at least three independent experiments with three mice per group. (J) Percentages of Csf2+ cells among gated colonic lamina propria NCR+ ILC3 and LTi cells in mice treated with anti-Csf1R mAb or control mAb. Staining was performed on total cells cultured for 4 hours with or without IL-1β in the presence of Brefeldin A. Data are shown as mean ± SD of three independent experiments with three mice per group. (K) Csf2 production by colonic lamina propria NCR+ ILC3 and LTi cells in Myd88ΔT/LTi mice measured after 4 hours of culture with or without IL-1β in the presence of Brefeldin A. Data are shown as mean ± SD of three independent experiments with at least three mice per group. Student’s t test (D, H, and I) or one-way ANOVA Bonferroni’s multiple comparison test (B, C, F, G, J, and K) were performed. Statistical significance is indicated by *P < 0.05, **P < 0.01, and ***P < 0.001.
Fig. 4
Fig. 4. ILC3-derived Csf2 controls oral tolerance to dietary antigens
(A) Naïve OTII Rag2−/− CD45.1+ T cells were adoptively transferred into CD45.2+ C57Bl/6 and CD45.2+ Csf2−/− mice. Bar graph shows percentages of small intestinal and colonic OTII-specific Foxp3+ Tregs after oral feeding with OVA ad libidum. Data are shown as mean ± SD of three independent experiments with three mice per group. (B) Bar graph shows percentages of Ki67+ colonic Foxp3+ OTII T cells in C57Bl/6 and Csf2−/− mice after OVA feeding. Data are shown as mean ± SD of three independent experiments with three mice per experiment. (C and D) Naïve OTII Rag2−/− CD45.1+ T cells were adoptively transferred into C57Bl/6 and Myd88ΔT/LTi mice (C), or Rag2−/− and Rag2−/−Il2rg−/− mice (D). Bar graphs show percentages of small intestinal and colonic OTII-specific Foxp3+ Tregs after OVA feeding. Data are shown as mean ± SD of three independent experiments with three mice per group. (E) Csf2−/−, Myd88ΔT/LTi and control mice were either fed (+) or not fed with OVA (–) for 7 days to induce oral tolerance. Four days later, fed mice were immunized subcutaneously with OVA (300 µg) and complete Freund’s adjuvant and rechallenged 14 days later with OVA (50 µg) into the right ear, as described in the materials and methods. Skin DTH response was determined by ear swelling (mm). Data are shown as mean ± SD (n = 10 mice) and are representative of two independent experiments. (F and G) Purified wild-type or Csf2−/− ILC3 were injected into Rag2−/−Il2rg−/−hosts, 2 weeks before injection of naïve OTII CD45.1+ T cells. Reconstituted hosts were fed with OVA and analyzed 5 days later. (F) Bar graph shows percentages of Csf2+ CD45+ cells (left) and total CD90+ CD45+ ILCs (right) in the colonic lamina propria of the indicated host mice. Data are shown as mean ± SD of two independent experiments with three mice per group. (G) Bar graphs show percentages of small intestinal and colonic OTII-specific Foxp3+ Tregs after OVA feeding. Data are shown as mean ± SD of two independent experiments with three mice per group. Student’s t test (A to D) or one-way ANOVA Bonferroni’s multiple comparison test (E to G) were performed. Statistical significance is indicated by *P < 0.05, **P < 0.01, and ***P < 0.001.

Comment in

  • Immunology. The axis of tolerance.
    Aychek T, Jung S. Aychek T, et al. Science. 2014 Mar 28;343(6178):1439-40. doi: 10.1126/science.1252785. Science. 2014. PMID: 24675941 No abstract available.

References

    1. Maloy KJ, Powrie F. Intestinal homeostasis and its breakdown in inflammatory bowel disease. Nature. 2011;474:298–306. pmid: 21677746. - PubMed
    1. Khor B, Gardet A, Xavier RJ. Genetics and pathogenesis of inflammatory bowel disease. Nature. 2011;474:307–317. pmid: 21677747. - PMC - PubMed
    1. Ivanov II, et al. Induction of intestinal Th17 cells by segmented filamentous bacteria. Cell. 2009;139:485–498. pmid: 19836068. - PMC - PubMed
    1. Hooper LV, Littman DR, Macpherson AJ. Interactions between the microbiota and the immune system. Science. 2012;336:1268–1273. pmid: 22674334. - PMC - PubMed
    1. Atarashi K, et al. Induction of colonic regulatory T cells by indigenous Clostridium species. Science. 2011;331:337–341. pmid: 21205640. - PMC - PubMed

Publication types

MeSH terms

Substances