. 2014 Mar 13;5(3):e1122.
doi: 10.1038/cddis.2014.77.

Two combined photosensitizers: a goal for more effective photodynamic therapy of cancer

Affiliations

Two combined photosensitizers: a goal for more effective photodynamic therapy of cancer

P Acedo et al. Cell Death Dis. .

Abstract

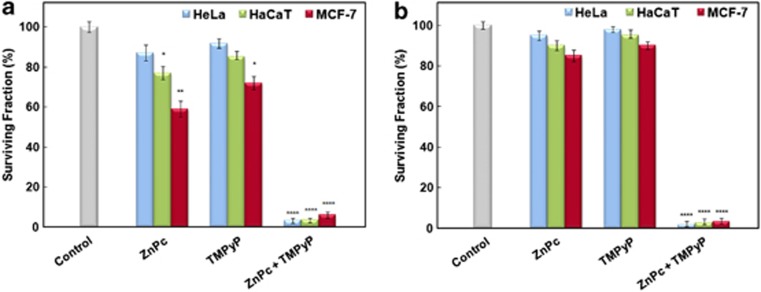
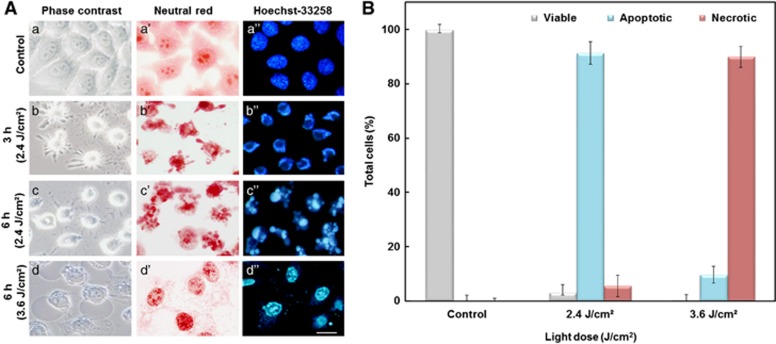
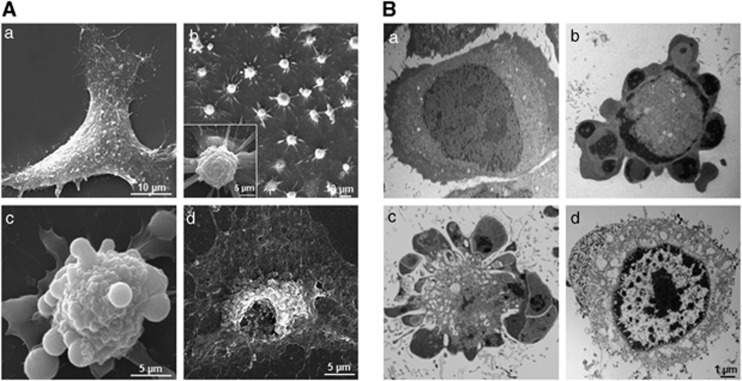
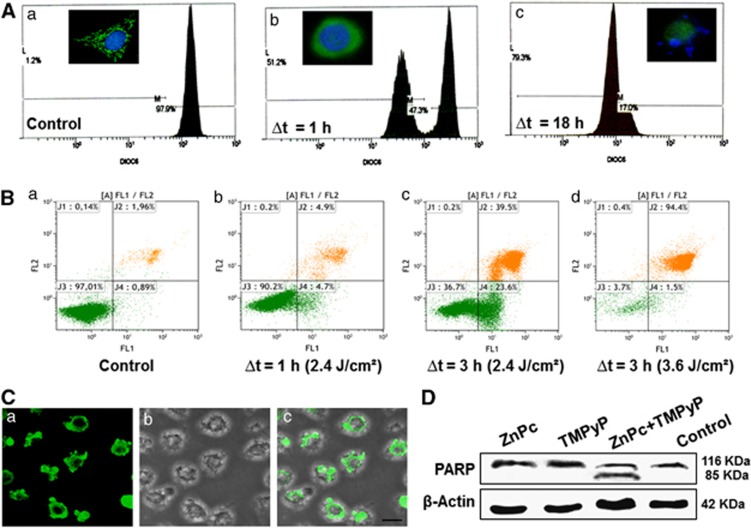
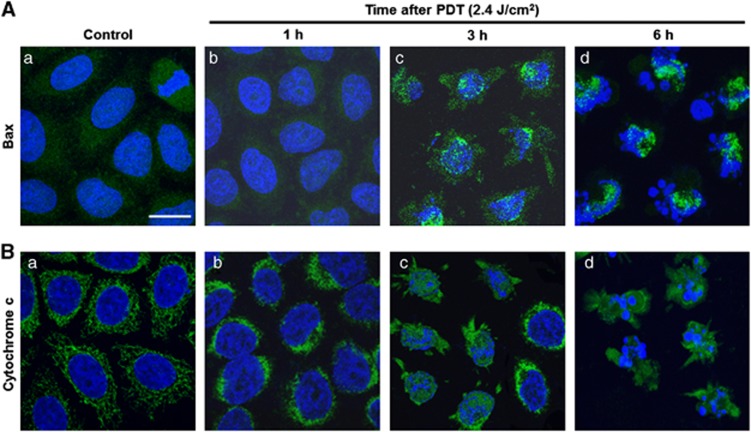
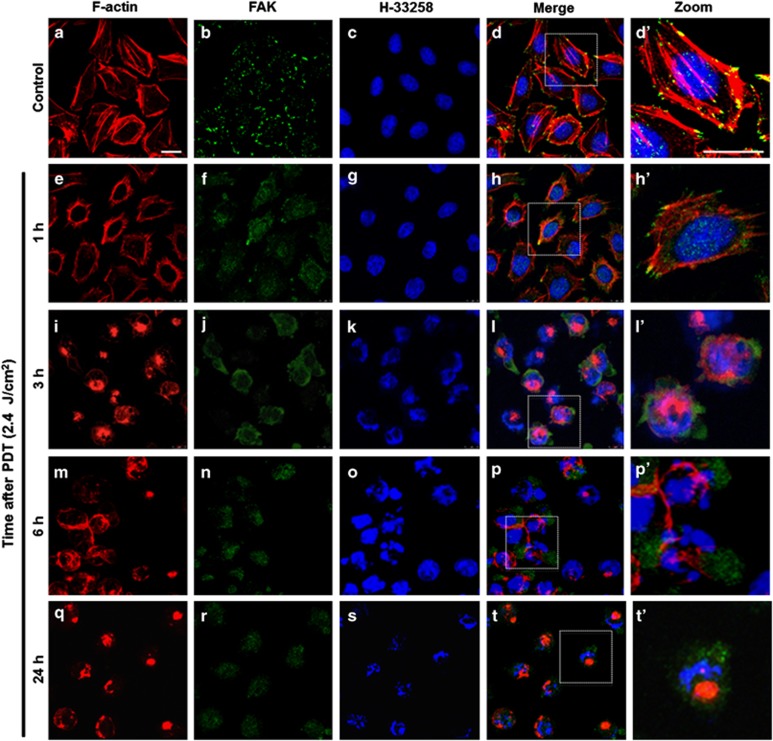
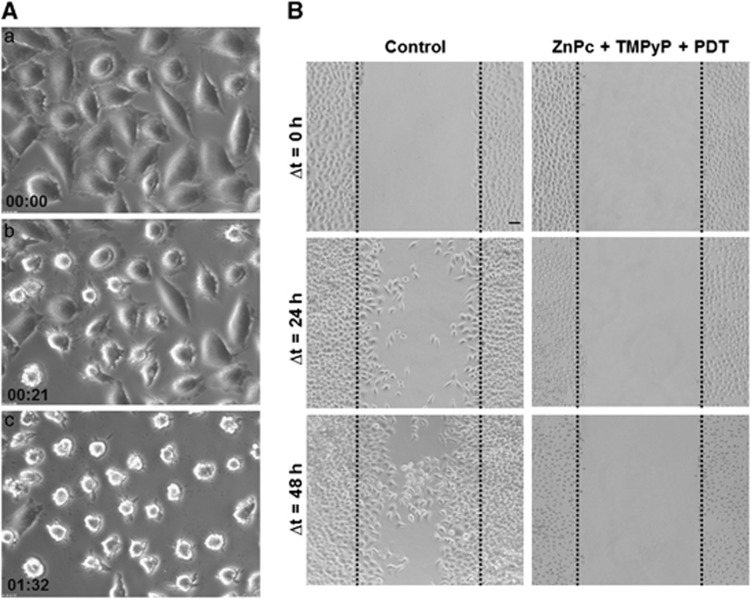
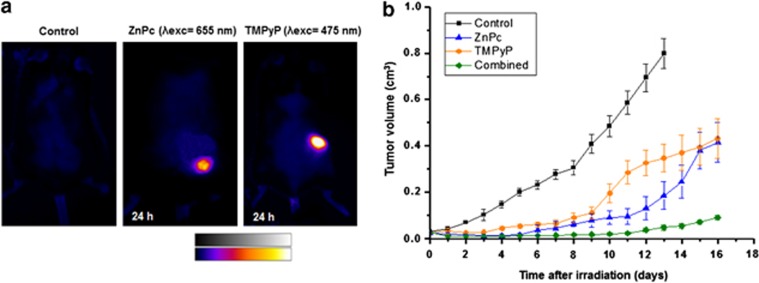
Photodynamic therapy (PDT) is a clinically approved therapeutic modality for the treatment of diseases characterized by uncontrolled cell proliferation, mainly cancer. It involves the selective uptake of a photosensitizer (PS) by neoplastic tissue, which is able to produce reactive oxygen species upon irradiation with light, leading to tumor regression. Here a synergistic cell photoinactivation is reported based on the simultaneous administration of two PSs, zinc(II)-phthalocyanine (ZnPc) and the cationic porphyrin meso-tetrakis(4-N-methylpyridyl)porphine (TMPyP) in three cell lines (HeLa, HaCaT and MCF-7), using very low doses of PDT. We detected changes from predominant apoptosis (without cell detachment) to predominant necrosis, depending on the light dose used (2.4 and 3.6 J/cm(2), respectively). Analysis of changes in cytoskeleton components (microtubules and F-actin), FAK protein, as well as time-lapse video microscopy evidenced that HeLa cells were induced to undergo apoptosis, without losing adhesion to the substrate. Moreover, 24 h after intravenous injection into tumor-bearing mice, ZnPc and TMPyP were preferentially accumulated in the tumor area. PDT with combined treatment produced significant retardation of tumor growth. We believe that this combined and highly efficient strategy (two PSs) may provide synergistic curative rates regarding conventional photodynamic treatments (with one PS alone).


Figures

Figure 1
Figure 1
Surviving fractions of HeLa, HaCaT, and MCF-7 cells incubated with ZnPc 5 × 10⁻⁸ M, TMPyP 10−6 M, or ZnPc 5 × 10⁻⁸ M+TMPyP 10−6 M for 1 h, followed by red irradiation (2.4 J/cm2) at 24 (a) and 48 h (b). Combined treatment produces highly significant effects on the survival of the three cell lines used. Data correspond to mean±S.D. values from at least six different experiments. Statistically significant differences are labeled as *P<0.05, **P<0.01, and ****P<0.0001, for comparisons between groups using one-way ANOVA with Tukey's multiple comparison post-hoc test. In all cell lines at 24 and 48 h: combination-treated cells versus all other groups (****). In HaCaT cells only at 24 h: ZnPc versus control (*). In MCF-7 cells only at 24 h: TMPyP versus control (*) and ZnPc versus control (**)
Figure 2
Figure 2
(A) Morphology of HeLa cells in phase contrast or DIC and after NR or H-33258 staining. (a–a″) Control cells. (b–c″) Cells incubated for 1 h with both PSs followed by red light irradiation (2.4 J/cm2) and observed 3 and 6 h later, respectively. Note the increasing amount of cells with clear apoptotic morphology (cell shrinkage and chromatin fragmentation). (d–d″) Morphological changes of cells incubated for 1 h with both PSs and subjected to red light irradiation (3.6 J/cm2), 6 h after treatment. Note the homogeneous nuclear condensation and giant bubbles characteristic of necrosis. Scale bar=10 μm. (B) Percentage of apoptotic or necrotic HeLa cells 24 h after combined-photodynamic treatment using two different light doses, 2.4 or 3.6 J/cm2, respectively. Values are mean±S.D. of three independent determinations
Figure 3
Figure 3
(A) Morphological changes of HeLa cells incubated 1 h with both PSs and subjected to red light irradiation, visualized by scanning electron microscopy (SEM). (a) Interphase control cell. (b) Apoptotic cells observed for 3 h upon PDT (2.4 J/cm2). (c) Cells in apoptosis 6 h after treatment (2.4 J/cm2). (d) Rest of the necrotic cells 6 h after PDT (3.6 J/cm2). (B) Micrographs taken by transmission electron microscopy (TEM). (a) Untreated (control) cells. (b) Apoptotic cells 3 h after combined PDT (2.4 J/cm2). (c) Typical apoptotic cells 6 h after PDT (2.4 J/cm2). (d) Necrotic cells 6 h after PDT (3.6 J/cm2)
Figure 4
Figure 4
(A) Analysis of mitochondrial membrane potential (Δψm) by flow cytometry revealed by DiOC6(3) fluorescence and representative images of cell sample in fluorescence microscopy. (a) Control cells. (b, c) HeLa cells after combined PDT for 1 and 18 h, respectively. (B) Representative flow cytometry histograms of annexin-V-FITC in combination with PI staining detection. (a) Control cells. (b, c) Treated cells (2.4 J/cm2) 1 and 3 h upon combined treatment, respectively. (d) Treated cells at 3 h (3.6 J/cm2). (C) Apoptotic cells after 6 h combined treatment were assessed by TUNEL assay. (a) Bright green fluorescent nuclear spots represent TUNEL-positive cells. (b) Phase contrast or DIC. (c) Merged image. Scale bar=10 μm. (D) Fragmentation of PARP revealed by western blotting. Only cells treated with both PSs and irradiated (2.4 J/cm2) showed cleavage of PARP into two fragments
Figure 5
Figure 5
Apoptosis induction after 1 h treatment with 5 × 10⁻⁸ M ZnPc+10-6 M TMPyP followed by 2.4 J/cm2 irradiation. (A) HeLa cells visualized by Bax immunofluorescence (green) and H-33258 counterstaining of nuclei (blue). (a Control cells with diffuse Bax signal. (b–d) Cells 1, 3, and 6 h after photodynamic treatment, respectively, showing mitochondrial Bax signal in cells with condensed and fragmented chromatin 3 and 6 h after photodynamic treatment. (B) Effect of combined PDT on subcellular distribution of cytochrome c detected by indirect immunofluorescence staining (green) and DNA counterstaining with H-33258 (blue). (a) Untreated cells. (b–d) HeLa cells 1, 3, and 6 h after treatment. Cytochrome c was released to the cytosol in cells showing condensed and fragmented chromatin 6 h after irradiation. Scale bar=10 μm
Figure 6
Figure 6
Phalloidin-TRITC visualization of F-actin (red), immunofluorescence of FAK (green), H-33258 staining of DNA (blue), merged and higher-magnification images in HeLa cells. (ad′) Control cells. (et′) Cells 1, 3, 6, and 24 h after combined treatment, respectively. Scale bar=10 μm
Figure 7
Figure 7
(A) (a-c) Selected images of time-lapse videos from the same field of a HeLa cell culture showing initiation and progression of apoptosis after synergistic PDT treatment. Numbers at the bottom-left of each frame denote the time elapsed from the moment of irradiation (0, 30 and 90 min). (B) Analysis of cell migration by scratch wound assay. Only a negligible fraction of HeLa cells shows the capacity of closing wounds following PDT-induced damage. Scale bar=50 μm
Figure 8
Figure 8
(a) Fluorescence images of in vivo accumulation of each PS were taken 24 h after intravenous injection and processed by ImageJ software (lookup table: fire). Exciting wavelengths are indicated. Color code for fluorescence intensity: white>yellow>orange>red>purple>blue>black. Control mouse was injected only with PBS. (b) Plots of mean tumor volumes in C57BL/6 mice bearing a subcutaneously transplanted amelanotic melanoma, after PDT treatments (600–700 nm, fluence rate of 175 mW/cm2 for a total fluence of 300 J/cm2) at 24 h after i.v. injection of 0.5 mg/kg ZnPc and/or 4.1 mg/kg TMPyP. Control group represents an absolute control (no light and no drug). Points are means of 6–8 tumors and bars are S.D.

References

    1. Agostinis P, Berg K, Cengel KA, Foster TH, Girotti AW, Gollnick SO, et al. Photodynamic therapy of cancer: an update. CA Cancer J Clin. 2011;61:250–281. - PMC - PubMed
    1. Yoo JO, Ha KS. New insights into the mechanisms for photodynamic therapy-induced cancer cell death. Int Rev Cell Mol Biol. 2012;295:139–174. - PubMed
    1. Allison RR, Moghissi K. Oncologic photodynamic therapy: clinical strategies that modulate mechanisms of action. Photodiagnosis. Photodyn Ther. 2013;10:331–341. - PubMed
    1. Rizvi I, Celli JP, Evans CL, Abu-Yousif AO, Muzikansky A, Pogue BW, et al. Synergistic enhancement of carboplatin efficacy with photodynamic therapy in a three-dimensional model for micrometastatic ovarian cancer. Cancer Res. 2010;70:9319–9328. - PMC - PubMed
    1. Wei XQ, Ma HQ, Liu AH, Zhang YZ. Synergistic anticancer activity of 5-aminolevulinic acid photodynamic therapy in combination with low-dose cisplatin on Hela cells. Asian Pac J Cancer Prev. 2013;14:3023–3028. - PubMed

Publication types

MeSH terms

LinkOut - more resources