. 2012 Jul 16:1:3.
doi: 10.12688/f1000research.1-3.v1. eCollection 2012.

Low budget analysis of Direct-To-Consumer genomic testing familial data

Affiliations

Low budget analysis of Direct-To-Consumer genomic testing familial data

Gustavo Glusman et al. F1000Res. .

Abstract

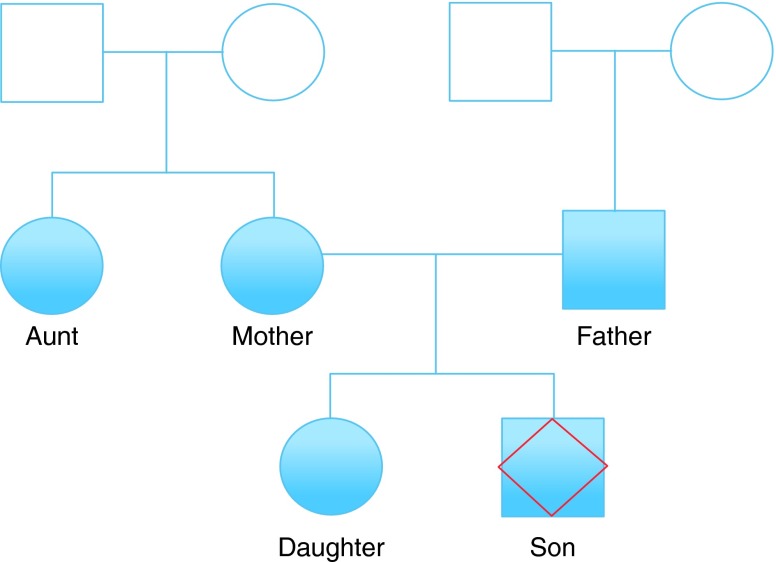
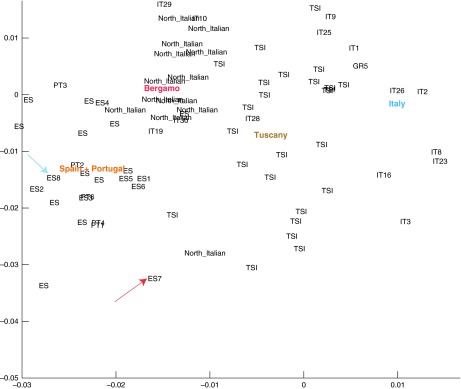
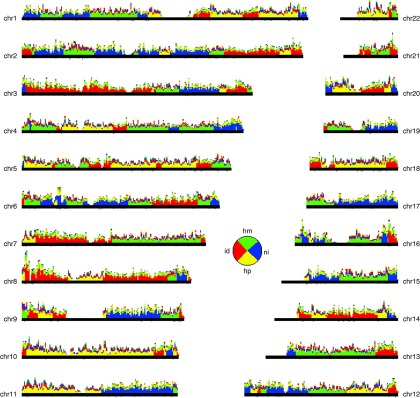
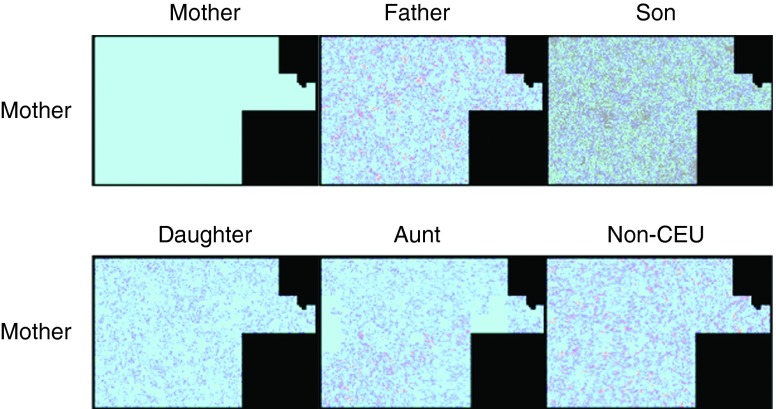
Direct-to-consumer (DTC) genetic testing is a recent commercial endeavor that allows the general public to access personal genomic data. The growing availability of personal genomic data has in turn stimulated the development of non-commercial tools for DTC data analysis. Despite this new wealth of public resources, no systematic research has been carried out to assess these tools for interpretation of DTC data. Here, we provide an initial analysis benchmark in the context of a whole family, using single nucleotide polymorphism (SNP) data. Five blood-related DTC SNP chip data tests were analyzed in conjunction with one whole exome sequence. We report findings related to genomic similarity between individuals, genetic risks and an overall assessment of data quality; thus providing an evaluation of the current potential of public domain analysis tools for personal genomics. We envisage that as the use of personal genome tests spreads to the general population, publicly available tools will have a more prominent role in the interpretation of genomic data in the context of health risks and ancestry.


Conflict of interest statement

Competing interests: Michael Cariaso is the developer of Promethease and SNPedia. Some aspects of the Promethease analysis shown here cost $2 per individual.

Figures

Figure 1.
Figure 1.. Family tree analyzed using DTC genotyping services.
Squares and circles denote male and female respectively. Filled shapes represent those for which genome data is available. ‘Son’, the individual whose exome was sequenced, is denoted with a red diamond. Other family members include Father, Mother, Daughter and Aunt, who is Mother’s sister.
Figure 2.
Figure 2.. Admixture analysis of individuals from Southern Europe from the Eurogenes Genetic Ancestry Project.
Mother (ES7) is denoted by a red arrow and Father (ES8) by a blue arrow. Mother and Father are the only family individuals included here as they have the most divergent genotypes within the family.
Figure 3.
Figure 3.. A distribution of all the different occurring genotypes as a percentage of the total for all individuals is shown.
For the purposes of unbiased comparison, only autosome data is included. I and D indicate insertion and deletion, respectively. Son’s percentages (v2) show slight differences to all other v3 individuals whose genotype proportions are more similar.
Figure 4.
Figure 4.. Inheritance State Consistency Analysis (ISCA) plot for the Father-Mother-Son-Daughter quartet, depicting for each autosome the number of informative SNPs supporting each of the four possible inheritance states: "identical" ("id", red), "haploidentical maternal" ("hm", green), "haploidentical paternal" ("hp", yellow) and "nonidentical" ("ni", blue).
SNPs consistent with two inheritance states contribute 0.5 weight to each. SNP counts are binned in non-overlapping 1 Mb windows; within each window, the four inheritance states are sorted by decreasing level of support. Regions without support typically overlap centromeric repeats and heterochromatic regions. Pie chart inset: fraction of the genome observed in each inheritance state.
Figure 5.
Figure 5.. A graphical representation of the SNPs from chromosome 1 for Mother com pared with herself, Father, Son, Sister, Aunt and non-CEU.
Each pixel represents a SNP. Light blue represents match, dark blue half-match and red conflict. SNPs in Son that are not present in the genotypes of the other individuals are represented in grey.

References

    1. Saxena R, Voight BF, Lyssenko V, et al. : Genome-wide association analysis identifies loci for type 2 diabetes and triglyceride levels. Science. 2007;316(5829):1331–1336 10.1126/science.1142358 - DOI - PubMed
    1. Phillips C, Salas A, Sánchez JJ, et al. : Inferring ancestral origin using a single multiplex assay of ancestry-informative marker SNPs. Forensic Sci Int Genet. 2007;1(3–4):273–280 10.1016/j.fsigen.2007.06.008 - DOI - PubMed
    1. Cariaso M, Lennon G: SNPedia: a wiki supporting personal genome annotation, interpretation and analysis. Nucleic Acids Res. 2012;40(Database issue):D1308–D1312 10.1093/nar/gkr798 - DOI - PMC - PubMed
    1. http://opensnp.org/
    1. http://www.mendeley.com/