Review
. 2014 Apr;30(4):124-32.
doi: 10.1016/j.tig.2014.02.003. Epub 2014 Mar 11.

Explaining additional genetic variation in complex traits

Affiliations
Review

Explaining additional genetic variation in complex traits

Matthew R Robinson et al. Trends Genet. 2014 Apr.

Abstract

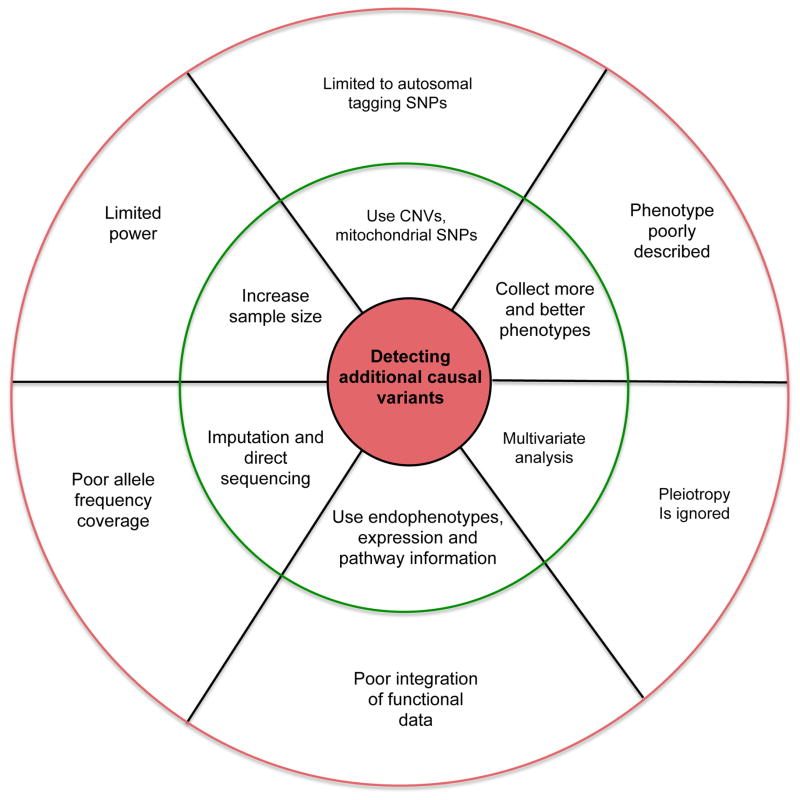
Genome-wide association studies (GWAS) have provided valuable insights into the genetic basis of complex traits, discovering >6000 variants associated with >500 quantitative traits and common complex diseases in humans. The associations identified so far represent only a fraction of those that influence phenotype, because there are likely to be many variants across the entire frequency spectrum, each of which influences multiple traits, with only a small average contribution to the phenotypic variance. This presents a considerable challenge to further dissection of the remaining unexplained genetic variance within populations, which limits our ability to predict disease risk, identify new drug targets, improve and maintain food sources, and understand natural diversity. This challenge will be met within the current framework through larger sample size, better phenotyping, including recording of nongenetic risk factors, focused study designs, and an integration of multiple sources of phenotypic and genetic information. The current evidence supports the application of quantitative genetic approaches, and we argue that one should retain simpler theories until simplicity can be traded for greater explanatory power.


Figures

BOX FIGURE I
BOX FIGURE I
For quantitative traits (a) the absolute effect is plotted against the minor allele frequency, and for complex common diseases (b) the odds ratio is plotted against the risk allele frequency. Each of the 38 quantitative traits and 43 disease traits are represented by different colors.
BOX FIGURE I
BOX FIGURE I
For quantitative traits (a) the absolute effect is plotted against the minor allele frequency, and for complex common diseases (b) the odds ratio is plotted against the risk allele frequency. Each of the 38 quantitative traits and 43 disease traits are represented by different colors.
FIGURE 1
FIGURE 1
(a) The number of low frequency variants required to explain the remaining missing heritability for human height and (b) the power to detect variants that underlie complex common disease with 10,000 cases and 10,000 matched controls. For (a) the heritability remaining hr2 for human height that is not explained by associations with common SNPs was taken to be 30% and the number of variants was estimated by hr22p(1-p)a2, where a is the effect size in SD (0.15, 0.25, 0.5, or 1) and p is the minor allele frequency of the causal variants. For (b) the power to detect variants for complex diseases of different prevalence with 10,000 cases and 10,000 matched controls.
FIGURE 1
FIGURE 1
(a) The number of low frequency variants required to explain the remaining missing heritability for human height and (b) the power to detect variants that underlie complex common disease with 10,000 cases and 10,000 matched controls. For (a) the heritability remaining hr2 for human height that is not explained by associations with common SNPs was taken to be 30% and the number of variants was estimated by hr22p(1-p)a2, where a is the effect size in SD (0.15, 0.25, 0.5, or 1) and p is the minor allele frequency of the causal variants. For (b) the power to detect variants for complex diseases of different prevalence with 10,000 cases and 10,000 matched controls.
FIGURE 2
FIGURE 2. Identifying additional causal variants and dissecting additional genetic variation for complex traits
Current limitations (outer circle) and potential solutions (inner circle) to targeting additional causal variants using whole genome studies.

References

    1. Lango Allen H, et al. Hundreds of variants clustered in genomic loci and biological pathways affect human height. Nature. 2010;467:832–8. - PMC - PubMed
    1. Lee SH, et al. Estimating the proportion of variation in susceptibility to schizophrenia captured by common SNPs. Nat Genet. 2012;44:247–50. - PMC - PubMed
    1. Visscher PM, et al. Five years of GWAS discovery. Am J Hum Genet. 2012;90:7–24. - PMC - PubMed
    1. Ripke S, et al. Genome-wide association analysis identifies 13 new risk loci for schizophrenia. Nat Genet. 2013;45:1150–9. - PMC - PubMed
    1. Morris AP, et al. Large-scale association analysis provides insights into the genetic architecture and pathophysiology of type 2 diabetes. Nat Genet. 2012;44:981–90. - PMC - PubMed

Publication types