. 2014 Oct 1;76(7):517-26.
doi: 10.1016/j.biopsych.2014.01.023. Epub 2014 Feb 5.

Default mode network mechanisms of transcranial magnetic stimulation in depression

Affiliations

Default mode network mechanisms of transcranial magnetic stimulation in depression

Conor Liston et al. Biol Psychiatry. .

Abstract

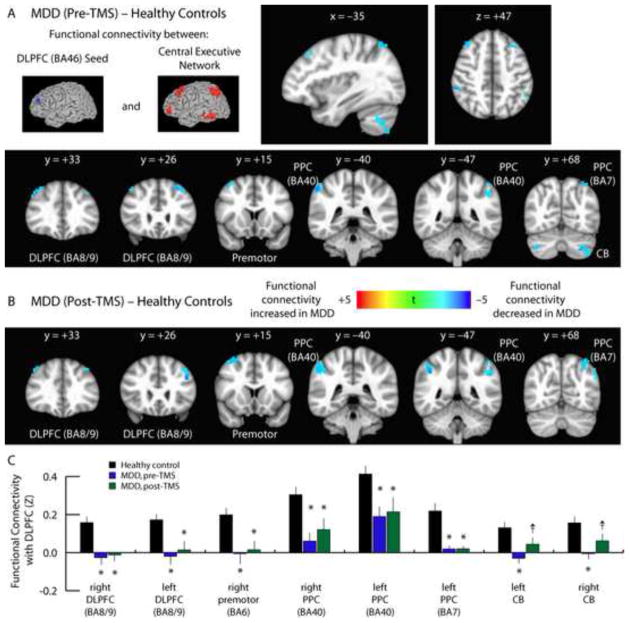
Background: Repetitive transcranial magnetic stimulation (TMS) of the dorsolateral prefrontal cortex (DLPFC) is an established treatment for depression, but its underlying mechanism of action remains unknown. Abnormalities in two large-scale neuronal networks-the frontoparietal central executive network (CEN) and the medial prefrontal-medial parietal default mode network (DMN)-are consistent findings in depression and potential therapeutic targets for TMS. Here, we assessed the impact of TMS on activity in these networks and their relation to treatment response.

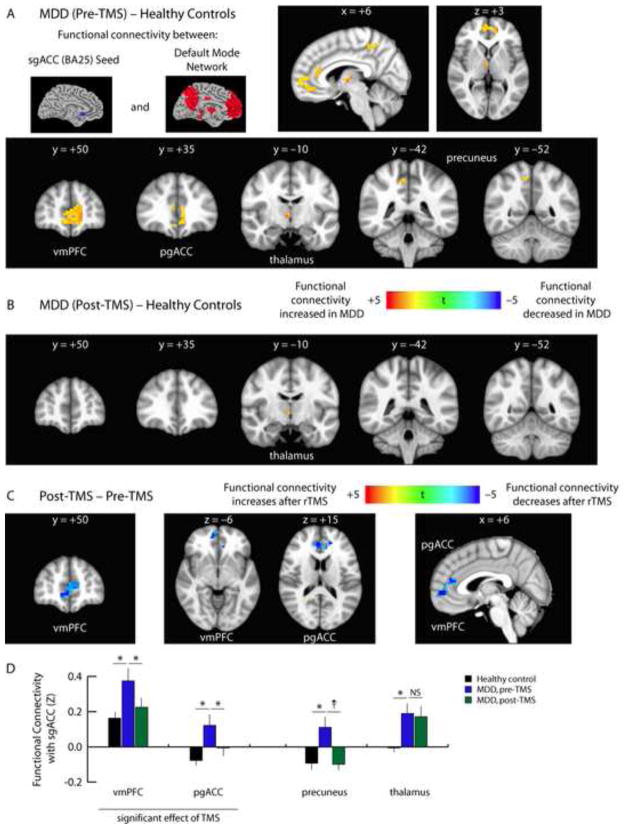
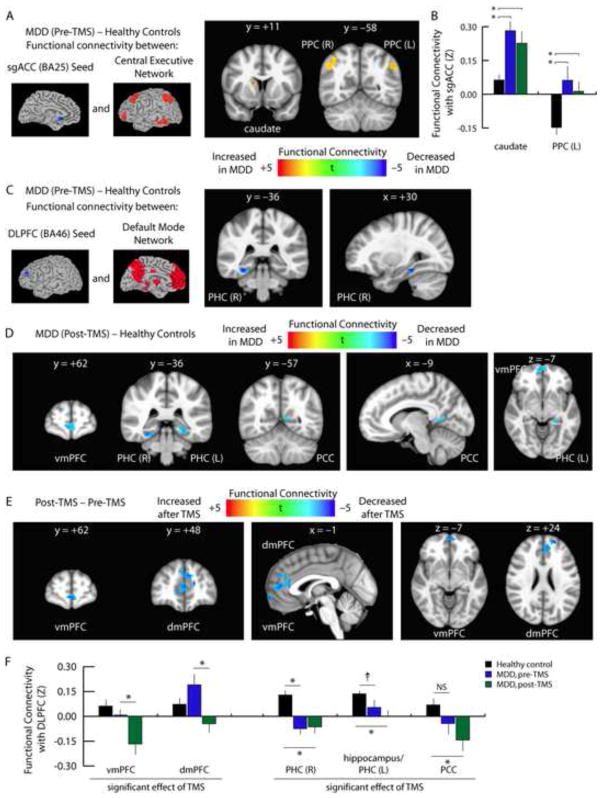
Methods: We used resting state functional magnetic resonance imaging to measure functional connectivity within and between the DMN and CEN in 17 depressed patients, before and after a 5-week course of TMS. Motivated by prior reports, we focused on connectivity seeded from the DLPFC and the subgenual cingulate, a key region closely aligned with the DMN in depression. Connectivity was also compared with a cohort of 35 healthy control subjects.

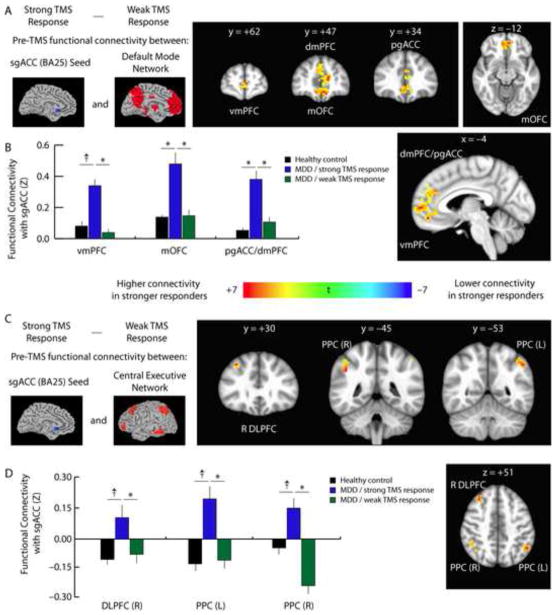
Results: Before treatment, functional connectivity in depressed patients was abnormally elevated within the DMN and diminished within the CEN, and connectivity between these two networks was altered. Transcranial magnetic stimulation normalized depression-related subgenual hyperconnectivity in the DMN but did not alter connectivity in the CEN. Transcranial magnetic stimulation also induced anticorrelated connectivity between the DLPFC and medial prefrontal DMN nodes. Baseline subgenual connectivity predicted subsequent clinical improvement.

Conclusions: Transcranial magnetic stimulation selectively modulates functional connectivity both within and between the CEN and DMN, and modulation of subgenual cingulate connectivity may play an important mechanistic role in alleviating depression. The results also highlight potential neuroimaging biomarkers for predicting treatment response.

Keywords: Central executive network; TMS; default mode network; depression; resting state fMRI.


Figures

Fig. 1
Fig. 1. Persistence of depression-related hypoconnectivity in the CEN after TMS
A. Compared to healthy control subjects, depressed patients exhibited decreased functional connectivity between the DLFPC and multiple nodes of the central executive network, including premotor cortex (BA6), two regions of posterior parietal cortex (PPC: BA40, BA7), bilateral cerebellum (CB), and other areas of lateral prefrontal cortex (DLPFC: BA8/9). Images depict t statistics for the contrast of patients pre-treatment versus healthy controls. These images and all subsequent images are presented in radiological convention and are labeled with the corresponding planar coordinate in MNI space. B. These effects persisted when the same patients were scanned after completing a 5-week course of TMS. C. Quantification of data extracted from the coordinates of the peak t statistic from each of the areas labeled in panels 1A and 1B. For coordinates and statistics, see Supplemental Table S4. Error bars = S.E.M. * = p < 0.05, corrected for multiple comparisons. † = p < 0.01, uncorrected, but not significant after correcting for multiple comparisons.
Fig. 2
Fig. 2. TMS attenuates depression-related hyperconnectivity within the DMN
A. Compared to healthy control subjects, depressed patients exhibited increased functional connectivity between the sgACC and multiple nodes of the default mode network, including the ventromedial prefrontal cortex (vmPFC), pregenual anterior cingulate cortex (pgACC), thalamus, and precuneus. Images depict t statistics for the contrast of patients pre-treatment versus healthy controls. B. All areas of sgACC hyperconnectivity normalized after TMS, except within the thalamus. C. Repeated measures ANCOVA revealed significant effects of TMS on sgACC connectivity with the ventromedial prefrontal cortex (vmPFC) and pregenual anterior cingulate cortex (pgACC). Hyperconnectivity with the precuneus tended to normalize after treatment, but this effect did not reach significance after correcting for multiple comparisons. D. Quantification of data extracted from the coordinates of the peak t statistic from each of the areas labeled in panels 2A–C. For coordinates and statistics, see Supplemental Table S5. Error bars = S.E.M. * = p < 0.05, corrected for multiple comparisons. † = p < 0.01, uncorrected, but not significant after correcting for multiple comparisons. NS = not significant.
Figure 3
Figure 3. TMS modulates interactions between the DMN and CEN
A. Compared to healthy control subjects, functional connectivity between the sgACC and the CEN was abnormally elevated in depressed patients. Affected areas included the right caudate nucleus and bilateral posterior parietal cortex (PPC, BA40). Images depict t statistics for the contrast of patients prior to treatment versus healthy controls. B. Quantification of the data depicted in panel 3A. Hyperconnectivity with the right caudate, left posterior parietal cortex, and right posterior parietal cortex (data not shown, see Supplemental Fig. S10) persisted after treatment, and there were no significant effects of TMS. Error bars = S.E.M. * = p < 0.05, corrected for multiple comparisons. C. In contrast, depressed patients exhibited decreased functional connectivity between the DLPFC and a right parahippocampal area (PHC) of the DMN. D. Hypoconnectivity between the DLPFC and the DMN either persisted or increased after TMS. Affected areas included ventromedial (vmPFC), bilateral parahippocampal cortex (PHC), and posterior cingulate cortex (PCC). E. Repeated measures ANCOVA identified significant effects of TMS on functional connectivity between the DLPFC and two medial prefrontal areas of the DMN. The vmPFC cluster overlapped with the cluster in panel 3D. In both areas, connectivity was reduced, and neither area differed from controls prior to treatment. F. Quantification of data extracted from the coordinates of the peak t statistic from each of the areas labeled in panels 3C–E. For coordinates and statistics, see Supplemental Table S6. Error bars = S.E.M. * = p < 0.05, corrected for multiple comparisons. † = p < 0.01, uncorrected, but not significant after correcting for multiple comparisons. NS = not significant.
Fig. 4
Fig. 4. Baseline subgenual cingulate connectivity predicts treatment response
A. To test the hypothesis that individual differences in default mode and central executive network connectivity may influence patients’ response to TMS, we compared the pre-treatment functional connectivity maps for patients who subsequently showed a stronger to treatment versus those who showed a weaker response to treatment, based on a median split of patients’ percent change in HAM-D scores. Prior to treatment, patients who subsequently showed larger clinical benefits had higher subgenual cingulate connectivity with multiple nodes of the DMN, including the ventromedial (vmPFC) and dorsomedial prefrontal cortex (dmPFC), pregenual anterior cingulate (pgACC), and medial orbitofrontal cortex (mOFC). B. Quantification of data extracted from the coordinates of the peak t statistic from each of the areas labeled in panel 4A. C. Patients who showed a stronger response to TMS also exhibited higher functional connectivity between sgACC, right DLPFC, and bilateral posterior parietal (PPC) areas of the CEN. D. Quantification of data extracted from the coordinates of the peak t statistic from each of the areas labeled in panel 4C. For coordinates and statistics, see Supplemental Table S7. Quantification of the data depicted in panel 4c. Error bars = S.E.M. * = p < 0.05, corrected for multiple comparisons. † = p < 0.01, uncorrected, but not significant after correcting for multiple comparisons.

References

    1. PascualLeone A, Rubio B, Pallardo F, Catala MD. Rapid-rate transcranial magnetic stimulation of left dorsolateral prefrontal cortex in drug-resistant depression. Lancet. 1996;348:233–237. - PubMed
    1. Rossi S, Hallett M, Rossini PM, Pascual-Leone A. Safety, ethical considerations, and application guidelines for the use of transcranial magnetic stimulation in clinical practice and research. Clinical Neurophysiology. 2009;120:2008–2039. - PMC - PubMed
    1. George MS, Lisanby SH, Avery D, McDonald WM, Durkalski V, Pavlicova M, et al. Daily Left Prefrontal Transcranial Magnetic Stimulation Therapy for Major Depressive Disorder A Sham-Controlled Randomized Trial. Archives of General Psychiatry. 2010;67:507–516. - PubMed
    1. Rush AJ, Trivedi MH, Wisniewski SR, Nierenberg AA, Stewart JW, Warden D, et al. Acute and longer-term outcomes in depressed outpatients requiring one or several treatment steps: A STAR*D report. American Journal of Psychiatry. 2006;163:1905–1917. - PubMed
    1. Trivedi MH, Rush AJ, Wisniewski SR, Nierenberg AA, Warden D, Ritz L, et al. Evaluation of outcomes with citalopram for depression using measurement-based care in STAR*D: Implications for clinical practice. American Journal of Psychiatry. 2006;163:28–40. - PubMed

Publication types