. 2014 Mar 13;156(6):1286-1297.
doi: 10.1016/j.cell.2014.01.029.

Dnmt1-independent CG methylation contributes to nucleosome positioning in diverse eukaryotes

Affiliations

Dnmt1-independent CG methylation contributes to nucleosome positioning in diverse eukaryotes

Jason T Huff et al. Cell. .

Abstract

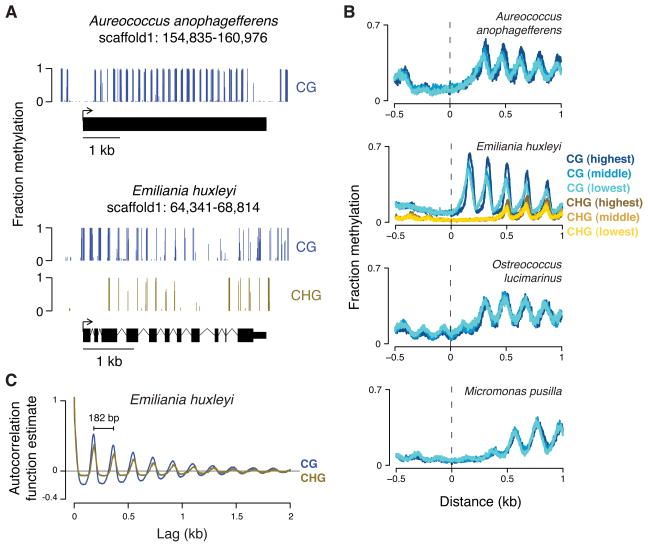
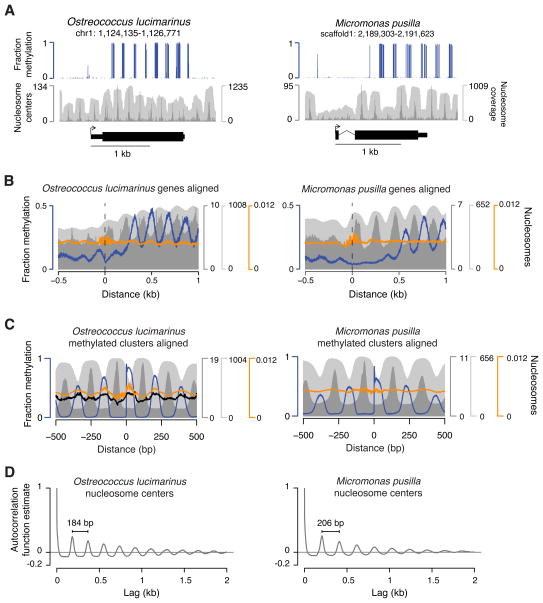
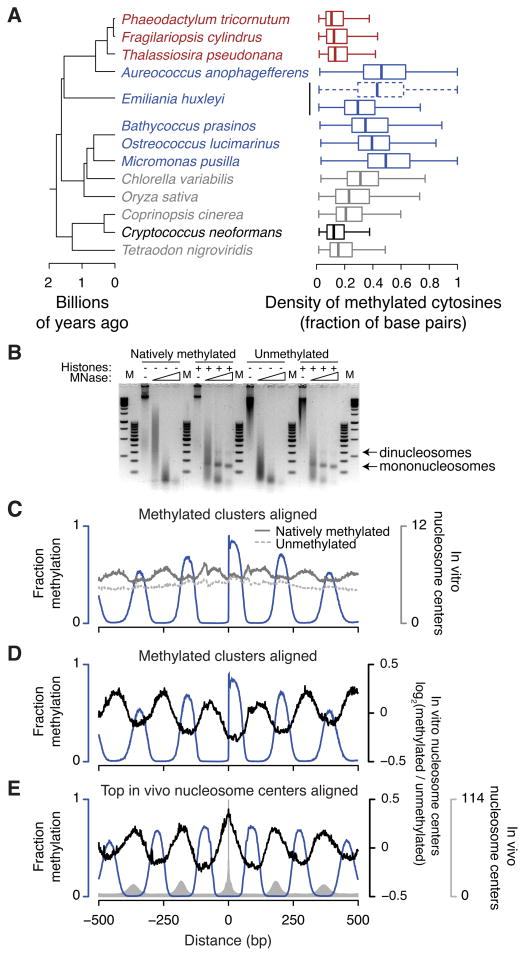
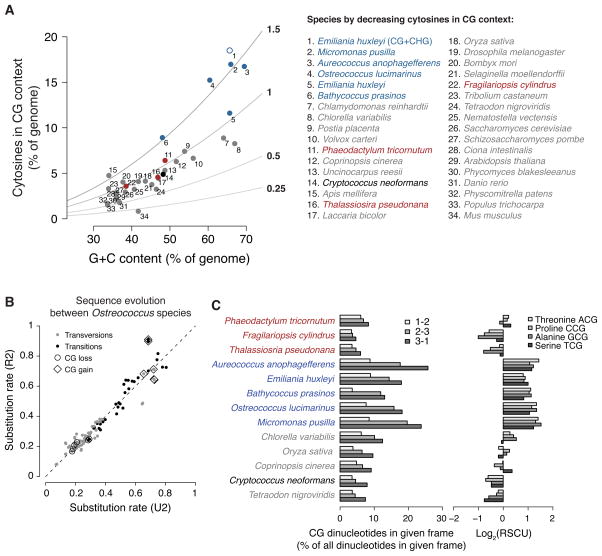
Dnmt1 epigenetically propagates symmetrical CG methylation in many eukaryotes. Their genomes are typically depleted of CG dinucleotides because of imperfect repair of deaminated methylcytosines. Here, we extensively survey diverse species lacking Dnmt1 and show that, surprisingly, symmetrical CG methylation is nonetheless frequently present and catalyzed by a different DNA methyltransferase family, Dnmt5. Numerous Dnmt5-containing organisms that diverged more than a billion years ago exhibit clustered methylation, specifically in nucleosome linkers. Clustered methylation occurs at unprecedented densities and directly disfavors nucleosomes, contributing to nucleosome positioning between clusters. Dense methylation is enabled by a regime of genomic sequence evolution that enriches CG dinucleotides and drives the highest CG frequencies known. Species with linker methylation have small, transcriptionally active nuclei that approach the physical limits of chromatin compaction. These features constitute a previously unappreciated genome architecture, in which dense methylation influences nucleosome positions, likely facilitating nuclear processes under extreme spatial constraints.


Figures

Figure 1
Figure 1. Dnmt1-independent CG methylation is associated with Dnmt5 in diverse eukaryotes
(A) Predicted C5 cytosine methyltransferase domains from eukaryotes and bacteria were aligned and a maximum likelihood tree was inferred. The gray branches are mostly bacterial sequences, but also include several “orphan” sequences from eukaryotes for which homologous sequences from other eukaryotic lineages were not apparent. Eukaryotic families are colored. The families we found are essentially equivalent to those identified using fewer sequences (Ponger and Li, 2005), so we retained the previous naming scheme, which includes the Dnmt4, Dnmt5, and Dnmt6 families. Numbers indicate percent bootstrap support for the nodes uniting each eukaryotic family. Divergent families, such as Dnmt2, Dnmt3, Dnmt4 and Dnmt6, have weak support (49–79% of bootstraps). The family groupings of Dnmt1, chromomethylase (Cmt), Dim-2 and Dnmt5 sequences are each strongly supported (92–100% of bootstraps). (B) Divergent lineages leading to individual species profiled here are single branches. Groups of species are shown as collapsed nodes, indicating earliest divergence times for species previously profiled for genome-wide methylation (Feng et al., 2010; Zemach et al., 2010). B. prasinos and O. lucimarinus are shown on the same branch, because their divergence time has not been estimated. (C) Predicted methyltransferases and Uhrf1 are indicated for each species or group in panel B. Families are colored as in panel A. In groups, presence is denoted for genes found in at least one member species. The dashed box highlights general lack of Dnmt1 and Uhrf1 and the solid box highlights Dnmt5. (D) Mean methylation in each sequence context (darkest to lightest: CG, CHG, CHH) is calculated for each species or group in panel B. For groups with multiple species, each bar represents the mean of member species with the line showing the range of underlying values for each species. *For Fungi non-CG methylation does not generally fall into CHG and CHH categories (Zemach et al., 2010). (E) Domains in a representative Dnmt5 protein; scale bar is 100 amino acids (aa). See also Figure S1 and Table S1.
Figure 2
Figure 2. Dnmt5 mediates symmetrical CG methylation
(A) Fractional CG methylation is shown with Tukey’s running median smoothing across chromosome 10. The positions of TEs are shown as black vertical lines at the top. Further analyses of TEs are in Figure S2B. Data are shown for wild-type genomic DNA grown and prepared at ATCC (WT) and the DNMT5-deleted strain we grew (dnmt5Δ). We also grew a control “wild-type” strain (WT47, a deletion of the unrelated gene SXI1), constructed with the same procedure as the strain with deletion of DNMT5 (Liu et al., 2008), to ensure that the absence of methylation in dnmt5Δ was not an artifact of the strain construction process or growth conditions. This also allows assessment of the reproducibility of our methylation data, which show strong quantitative similarity (Pearson’s r = 0.90 for the unsmoothed whole-genome data). For comparison, the data for the two WT strains are not correlated with those for the dnmt5Δ strain (Pearson’s r < 0.01 for both comparisons). (B) We analyzed the symmetry of methylation at CGCG sites genome-wide. To remove from the analysis uninformative regions where all of the cytosines are either methylated or unmethylated, we selected the CGCG sites that contain at least one cytosine with high (>85%) and one with low (<15%) methylation in the population of cells and with all cytosines having at least 10-fold sequencing coverage. For these informative sites in each species, the first bar (blue) shows the Pearson’s r of cytosines within CG sites and the second bar (orange) shows the Pearson’s r of the internal cytosines between adjacent CG sites. High-resolution examples of symmetrical methylation at CG sites are in Figure S2A.
Figure 3
Figure 3. Genomes of diverse species have periodic methylation in gene bodies, regardless of expression levels
(A) A snapshot of genomic methylation is shown for A. anophagefferens (top) and E. huxleyi (bottom) with each gene model below. (B) We assessed transcription by RNA-seq of total RNA. For each organism, genes were binned into 5 equally sized groups (quintiles) based on expression measured by FPKM (fragments per kilobase of transcript per million mapped reads). The mean methylation at each base pair position aligned to transcription start sites of genes from different quintiles is shown (CG, blue; CHG, gold). Only data for the first (lowest; lightest color), third (middle; middle color), and fifth (highest; darkest color) quintiles are shown for clarity. The average FPKM differences from the lowest to highest quintiles are approximately 100- to 1000-fold, depending on the organism. A similar plot for B. prasinos is in Figure S3A. (C) The autocorrelation function estimate for CG and CHG methylation is shown for each lag (offset) across the largest scaffold of E. huxleyi. The apparent periodicity for both is 182 base pairs (bp). Autocorrelation function estimates for other species are in Figure S3B.
Figure 4
Figure 4. Periodic methylation occurs specifically in nucleosome linkers
(A) A snapshot of genomic CG methylation and nucleosomes is shown for O. lucimarinus (left) and M. pusilla (right) with the gene model below. (B) Means at each position aligned to transcription start sites are shown for methylation and nucleosomes. (C) Means at each position aligned to CG methylation clusters are shown for methylation and nucleosomes. (D) The autocorrelation function estimates of nucleosome center counts per base are shown for each lag (offset) across the largest scaffold/chromosome of O. lucimarinus and M. pusilla. Apparent periodicities are indicated in base pairs (bp). Blue is fractional CG methylation, dark gray is center counts and light gray is fragment fold-coverage for in vivo nucleosomes. Black is fragment centers from naked MNase-digested O. lucimarinus DNA on the same scale as in vivo nucleosome centers. Orange is predicted nucleosome center probabilities from a published algorithm (Kaplan et al., 2009). See also Figure S4.
Figure 5
Figure 5. Methylation occurs at unprecedented densities and contributes to nucleosome positioning
(A) Distributions are shown of the density in each methylated region of base pairs containing methylated cytosines on either strand. For each group in Figure 1B we selected the species with the highest densities of genomic CG methylation (gray) to compare with periodically methylated genomes (blue). Diatoms and C. neoformans are colored red and black, respectively. For E. huxleyi, addition of CHG to CG sites is shown as a dashed box and whiskers. Boxes indicate the medians, first and third quartiles with whiskers indicating the most extreme values up to 1.5 times the interquartile ranges away from the boxes. (B) Digestion with increasing amounts of MNase reveals nucleosomes formed with purified recombinant histones and either natively methylated O. lucimarinus genomic DNA or unmethylated equivalent, generated by in vitro replication. M, 100 bp and 1 kb GeneRuler markers (Thermo). (C–E) Nucleosome positioning data from in vitro assemblies. In panel C the number of reads is shown for nucleosome centers assembled from natively methylated DNA (solid dark gray line) or from unmethylated DNA (dashed light gray line). Panels D and E show the base-2 logarithms of the ratios of reads in the methylated versus unmethylated assemblies (black lines), centered at log2(ratio)=0. In vitro nucleosome centers are aligned to methylation clusters (panels C,D) as in Figure 4C or to the top genomic positions for in vivo nucleosome centers (panel E). The blue lines show fractional CG methylation, and the gray bars in panel E show in vivo nucleosome centers for comparison. See also Figure S5.
Figure 6
Figure 6. Novel regime of CG-enriching genome evolution
(A) Cytosines in a CG context as percent of genomic bases versus G+C contents of individual genomes are plotted. The colors are as in Figure 5A, but gray includes most species with published methylation profiles. Observed-to-expected ratios for CG content are shown as lines with values immediately right of the plot. The addition of CHG to CG sites for E. huxleyi (#1) is an open blue circle. The complete legend is at the right. (B) Substitution rates between Ostreococcus species were estimated using either a general reversible (R2) or a general unrestricted (U2) dinucleotide model (Siepel and Haussler, 2004) from the non-coding sequences of aligned chromosomes (Table S2). R2 assumes that sequence evolution is time-reversible, but has the advantage of fewer mathematical parameters to estimate. We show the results of both R2 and U2 models to demonstrate that they generally agree (the dashed line shows the expectation if they had produced identical estimates). Transversions and transitions are colored gray and black, respectively. Substitutions that lose and gain CG sites are labeled with circles and diamonds, respectively. (C) For each of the species in Figure 5A, the frequency of CG dinucleotides as a percent of all dinucleotides in each codon frame (phase) is shown (left). “1–2” represents CG in the first and second positions of codons (lightest fill). These are CGN codons specifying arginine and are somewhat overrepresented in A. anophagefferens, E. huxleyi, O. lucimarinus and M. pusilla. “2–3” represents CG in the second and third positions of codons (medium fill). These codons encode amino acids that can be encoded by other codons. The enrichment of CG in this frame causes codon usage bias, shown by the base-2 logarithms of relative synonomous codon usages (RSCU (Sharp et al., 1986)) for each of the four NCG codons at right (lightest to darkest fill: ACG, CCG, GCG, TCG). High log2(RSCU) values for A. anophagefferens, E. huxleyi, B. prasinos, O. lucimarinus and M. pusilla NCG codons indicate that each of these codons is used to encode its respective amino acid more frequently than if codon usage were unbiased. “3–1” represents CG occurring across neighboring codons (center; darkest fill), which is the only frame in which CG enrichment does not necessarily alter encoded proteins or introduce codon usage bias. See also Figure S6.
Figure 7
Figure 7. The nuclei of periodically methylated organisms contain genomes under extreme spatial constraints
The base-10 logarithms of genome sizes in base pairs versus nuclear volumes in μm3 are shown for individual species/cell types. The black line at left shows the approximate upper limit for DNA concentration (200 mg ml−1) in nucleosomes (Leforestier and Livolant, 1997). The dashed blue lines show the highest and lowest average DNA concentrations among periodically methylated nuclei, approximately 100 and 40 mg ml−1, respectively. For reference the dashed gray lines at right show average DNA concentrations of 1 and 10 mg ml−1. Periodically methylated genomes are shown in dark blue (#9, 16, 17, 20, 24, 27 and 28). Both haploid (1N; #16) and diploid (2N; #9) E. huxleyi cell types are shown. Open circles are for species in which ploidy is unresolved. For example A. anophagefferens will be more constrained if diploid (if 2N; #17) than if haploid (if 1N; #20). The light blue point in the lower left is a relative of O. lucimarinus, O. tauri (#28), for which we did not profile DNA methylation, but for which highly accurate nuclear volume measurements are available (Henderson et al., 2007). The black point at lower center is C. neoformans (#25). We did not find published data for the nuclear volumes of diatoms. Gray points are species/cell types with a wide range of spatial constraints. The dark gray points at the upper center are vertebrate nuclei that contain mostly highly compacted heterochromatin (#1, 2, 6 and 7). References are in Table S3. See also Figure S7.

References

    1. Chang GS, Noegel AA, Mavrich TN, Müller R, Tomsho L, Ward E, Felder M, Jiang C, Eichinger L, Glöckner G, et al. Unusual combinatorial involvement of poly-A/T tracts in organizing genes and chromatin in Dictyostelium. Genome Res. 2012;22:1098–1106. - PMC - PubMed
    1. Charlesworth B, Charlesworth D. Elements of Evolutionary Genetics. Roberts and Company Publishers; 2010.
    1. Chodavarapu RK, Feng S, Bernatavichute YV, Chen PY, Stroud H, Yu Y, Hetzel JA, Kuo F, Kim J, Cokus SJ, et al. Relationship between nucleosome positioning and DNA methylation. Nature. 2010;466:388–392. - PMC - PubMed
    1. Cohen NM, Kenigsberg E, Tanay A. Primate CpG islands are maintained by heterogeneous evolutionary regimes involving minimal selection. Cell. 2011;145:773–786. - PubMed
    1. Coleman-Derr D, Zilberman D. DNA methylation, H2A.Z, and the regulation of constitutive expression. Cold Spring Harb Symp Quant Biol 2012 - PubMed

Publication types

Associated data