. 2014 Mar 13;156(6):1298-1311.
doi: 10.1016/j.cell.2014.02.031.

Genetic and clonal dissection of murine small cell lung carcinoma progression by genome sequencing

Affiliations

Genetic and clonal dissection of murine small cell lung carcinoma progression by genome sequencing

David G McFadden et al. Cell. .

Abstract

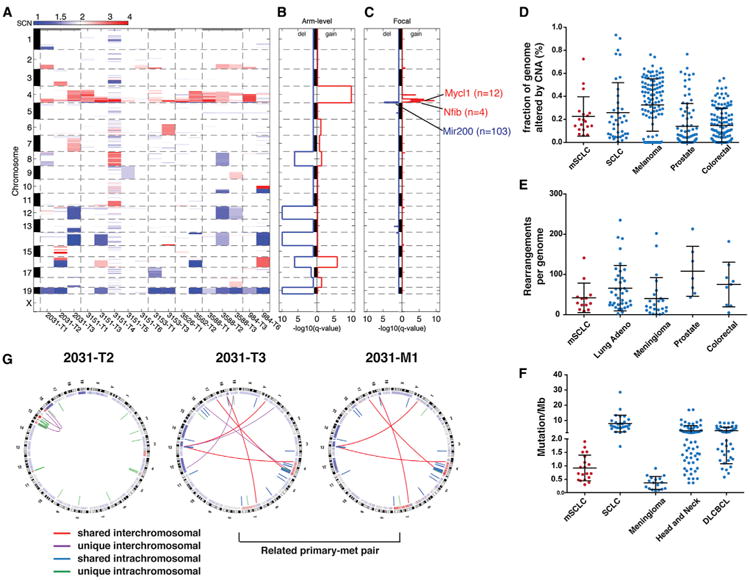
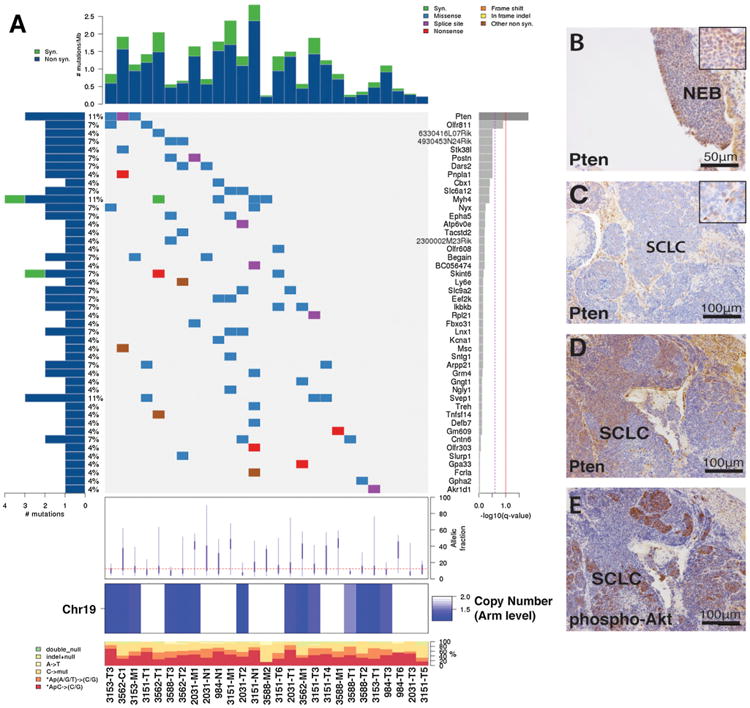
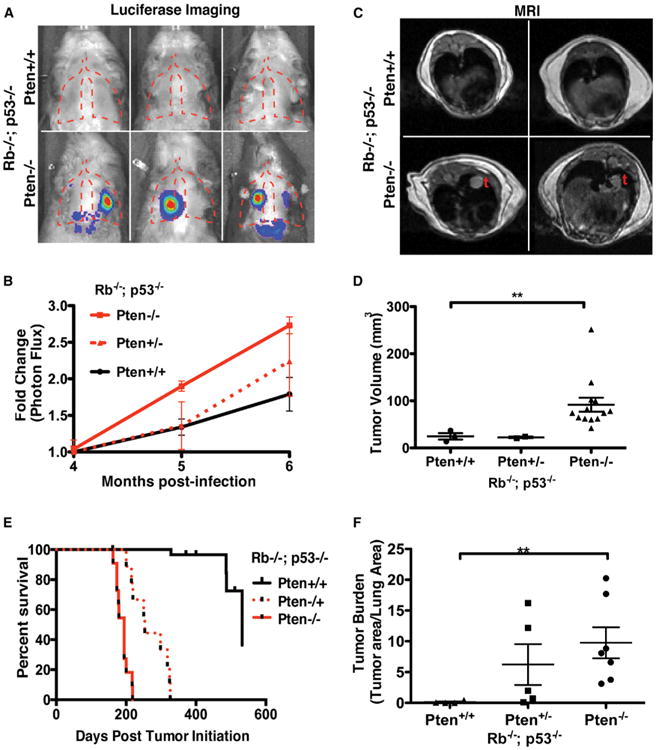
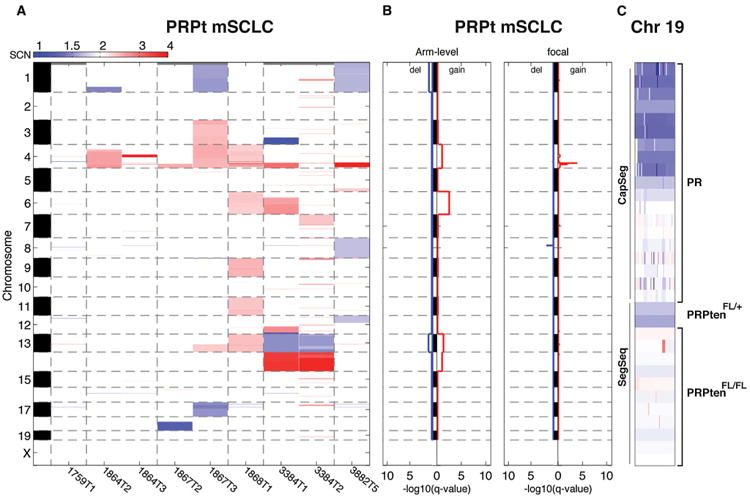
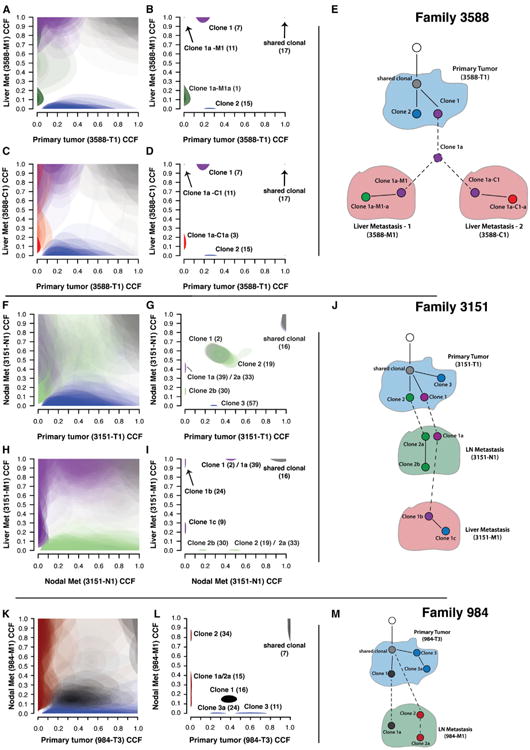
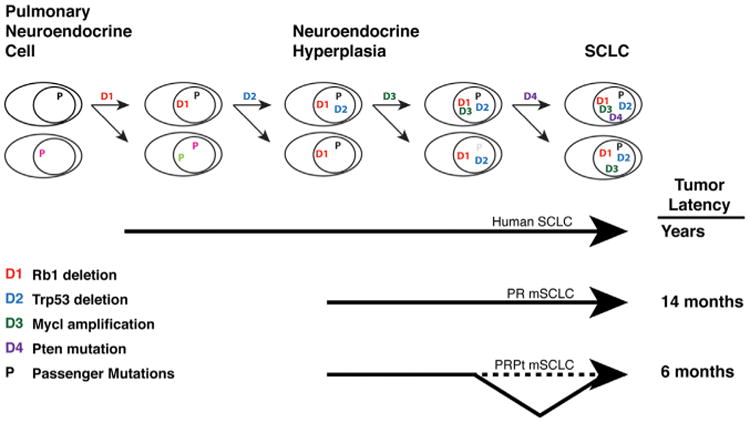
Small cell lung carcinoma (SCLC) is a highly lethal, smoking-associated cancer with few known targetable genetic alterations. Using genome sequencing, we characterized the somatic evolution of a genetically engineered mouse model (GEMM) of SCLC initiated by loss of Trp53 and Rb1. We identified alterations in DNA copy number and complex genomic rearrangements and demonstrated a low somatic point mutation frequency in the absence of tobacco mutagens. Alterations targeting the tumor suppressor Pten occurred in the majority of murine SCLC studied, and engineered Pten deletion accelerated murine SCLC and abrogated loss of Chr19 in Trp53; Rb1; Pten compound mutant tumors. Finally, we found evidence for polyclonal and sequential metastatic spread of murine SCLC by comparative sequencing of families of related primary tumors and metastases. We propose a temporal model of SCLC tumorigenesis with implications for human SCLC therapeutics and the nature of cancer-genome evolution in GEMMs.


Figures

Figure 1
Figure 1. Genome Remodeling during mSCLC Progression
(A) Global DNA copy number alterations (CNAs) shown for mSCLC primary tumors. Blue represents copy loss; red represents copy gain. Individual tumors shown horizontally, chromosomes depicted on vertical axis. (B) GISTIC analysis of recurrent whole-chromosome CNAs in mSCLC identifies recurrent loss of Chr19, Chr12, Chr14, and Chr16 and recurrent gain of Chr4. (C) GISTIC analysis of recurrent focal CNAs identifies six recurrent amplification peaks on Chr4 and a single area of recurrent copy number loss on Chr4. Genes of interest are listed next to focal gains and losses, and the number of genes in the peak of the CNA is shown in parentheses. (D) Comparison between mSCLC and human cancers with respect to the fraction of the genome altered by CNAs. (E) Comparison of mSCLC and human cancers with respect to the number of rearrangements per tumor. (F) mSCLCs exhibit a lower point mutation frequency compared to human cancers. (G) Circos diagrams depicting whole-genome sequencing of mSCLC. Shared rearrangements between primary tumors and metastases identify lineage relationships. Outer band represents metaphase banding pattern; inner track shows DNA copy number alterations. Intrachromosomal rearrangements are shown as blue (shared between multiple tumors) or green (unique); interchromosomal events are shown as red lines (shared between multiple tumors) or purple (unique). See also Figure S1 and Table S1. Error bars (D–F) represent mean and SD.
Figure 2
Figure 2. mSCLCs Acquire Recurrent Pten Alterations
(A) CoMut plot showing the individual mSCLC tumors on the x axis and mutation information on the y axes. Two genes are considered statistically significantly mutated: Pten and Olfr811. Left-sided histogram shows percent of samples with a mutation in the given gene in the right side of plot. Average allelic fraction of mutations in individual tumors shown below mutation plot, and Chr19 copy status shown at bottom of diagram. Number of mutations/sample shown on top histogram. (B) Pten immunohistochemistry (IHC) showing positive Pten staining in early premalignant neuroendocrine bodies (NEBs). (C) Pten IHC depicting a Pten-negative tumor. (D and E) Pten (D) and phospho-AKT(S473) (E) mutually exclusive IHC staining in the same mSCLC tumor. See also Figure S2 and Table S1.
Figure 3
Figure 3. Pten Deletion Accelerates mSCLC Progression
(A) Representative bright field/luminescence images. (B) Quantitation of luminescence (photon flux) of PR and PRPt animals. Relative photon flux calculated by normalizing all time points per animal to initial measurements at 4 months postinfection. (C) Representative axial MRI sections of PR and PRPt animals at 5 months postinfection. (D) MRI tumor volume measurements (mm3). (E) Overall survival of SCLC cohorts. (F) Relative tumor burden determined by quantitative hematoxylin and eosin staining microscopy. **p < 0.01. (B, D, and F) Mean and SEM shown by error bars. See also Figure S3 and Table S1.
Figure 4
Figure 4. Pten Deletion Alters Genome Evolution in mSCLC
(A) CNA heatmap for PRPt mSCLC tumors analyzed by SegSeq. (B) GISTIC results for recurrent CNAs. Note the absence of Chr19 deletion and presence of Chr4 focal amplification. (C) Chr19 copy number map for all primary tumors analyzed. Genotype is listed to the right. Analysis method (CapSeg or SegSeq) listed to the left. See also Figure S4 and Table S1.
Figure 5
Figure 5. Clonal Evolution of mSCLC during Metastatic Spread
Each tier (A–E, F–J, and K–M) shows ABSOLUTE analysis of related primary and metastatic tumors in an individual animal. Left column of plots (A), (C), (F), (H), and (K) shows unclustered CCF results for individual mutations in tumor pairs. Each cloud represents the 95% confidence interval of the predicted CCF for each mutation. Middle plots (B, D, G, I, and L) show the 95% confidence intervals following a Bayesian clustering procedure that groups mutations into predicted subclones. Clonal models based on ABSOLUTE results are shown in (E), (J), and (M). Dashed lines represent assumed transitions that are not directly observed in the data. In all panels, cloud color denotes membership in corresponding node (clone) in the model diagram. (A–D) CCF results demonstrating a single subclone (purple) from the primary tumor seeded two independent liver metastases. (F and G) shows multiple subclones from the primary tumor (clone 1 and clone 2) seeding a lymph node metastasis. Clone 1b (purple), a descendent of clone 1a, seeded a tertiary liver metastasis from the lymph node (H and I). (K and L) CCF results showing polyclonal seeding of a lymph node met (gray, clone 1a, and red, clone 2). See also Figure S5 and Table S1.
Figure 6
Figure 6. Model of SCLC Tumorigenesis
Stepwise acquisition of recurrent driver mutations identified by comparative SCLC sequencing (D1–D4) promotes murine SCLC progression from the pulmonary neuroendocrine cell to bona fide SCLC. As additional drivers are engineered into the mouse model, tumor latency is reduced and progression is accelerated. P, passenger mutations fixed in the tumor population during progression through the series of bottlenecks.

References

    1. Baca SC, Prandi D, Lawrence MS, Mosquera JM, Romanel A, Drier Y, Park K, Kitabayashi N, MacDonald TY, Ghandi M, et al. Punctuated evolution of prostate cancer genomes. Cell. 2013;153:666–677. - PMC - PubMed
    1. Berger MF, Lawrence MS, Demichelis F, Drier Y, Cibulskis K, Siva-chenko AY, Sboner A, Esgueva R, Pflueger D, Sougnez C, et al. The genomic complexity of primary human prostate cancer. Nature. 2011;470:214–220. - PMC - PubMed
    1. Beroukhim R, Getz G, Nghiemphu L, Barretina J, Hsueh T, Linhart D, Vivanco I, Lee JC, Huang JH, Alexander S, et al. Assessing the significance of chromosomal aberrations in cancer: methodology and application to glioma. Proc Natl Acad Sci USA. 2007;104:20007–20012. - PMC - PubMed
    1. Beroukhim R, Mermel CH, Porter D, Wei G, Raychaudhuri S, Donovan J, Barretina J, Boehm JS, Dobson J, Urashima M, et al. The landscape of somatic copy-number alteration across human cancers. Nature. 2010;463:899–905. - PMC - PubMed
    1. Biankin AV, Waddell N, Kassahn KS, Gingras MC, Muthuswamy LB, Johns AL, Miller DK, Wilson PJ, Patch AM, Wu J, et al. Pancreatic cancer genomes reveal aberrations in axon guidance pathway genes. Nature. 2012;491:399–405. - PMC - PubMed

Publication types