. 2014 Apr 3;94(4):496-510.
doi: 10.1016/j.ajhg.2014.02.009. Epub 2014 Mar 13.

Genetic origins of lactase persistence and the spread of pastoralism in Africa

Affiliations

Genetic origins of lactase persistence and the spread of pastoralism in Africa

Alessia Ranciaro et al. Am J Hum Genet. .

Abstract

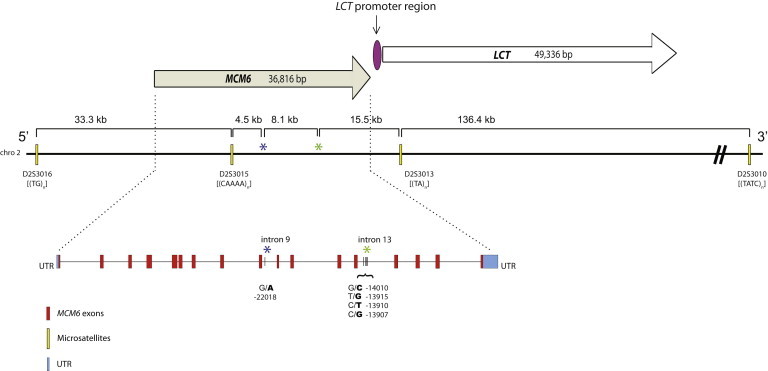
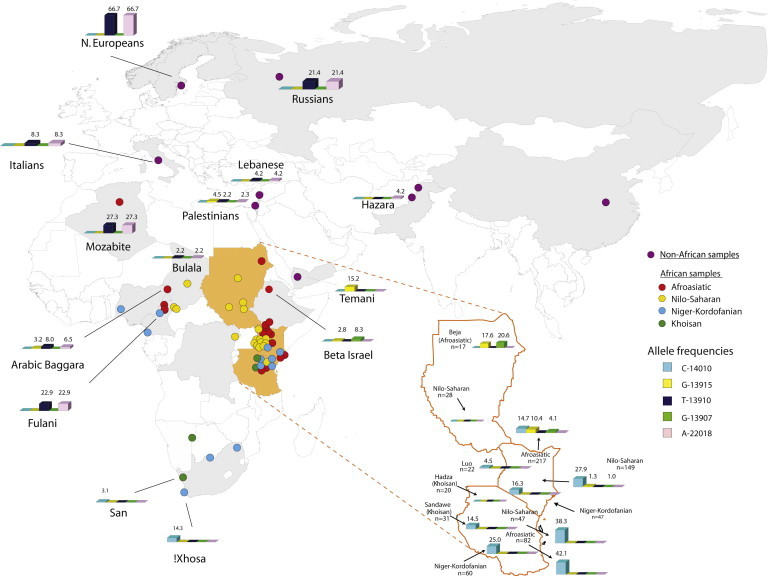
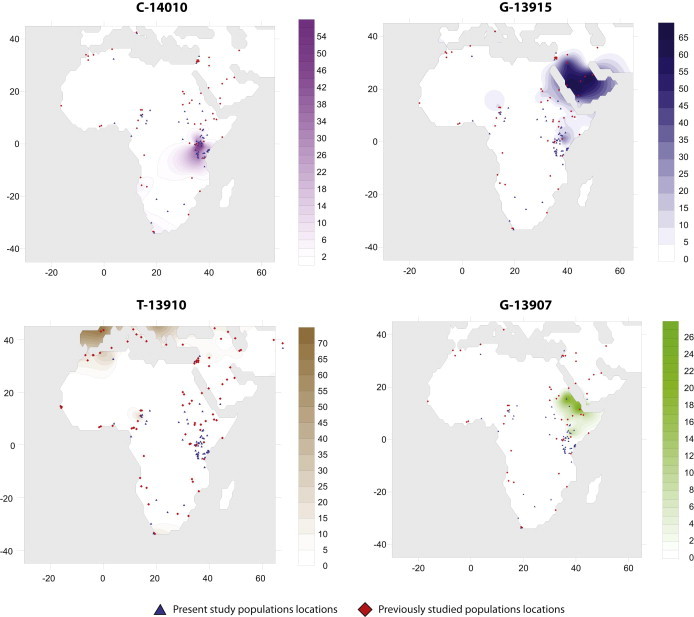
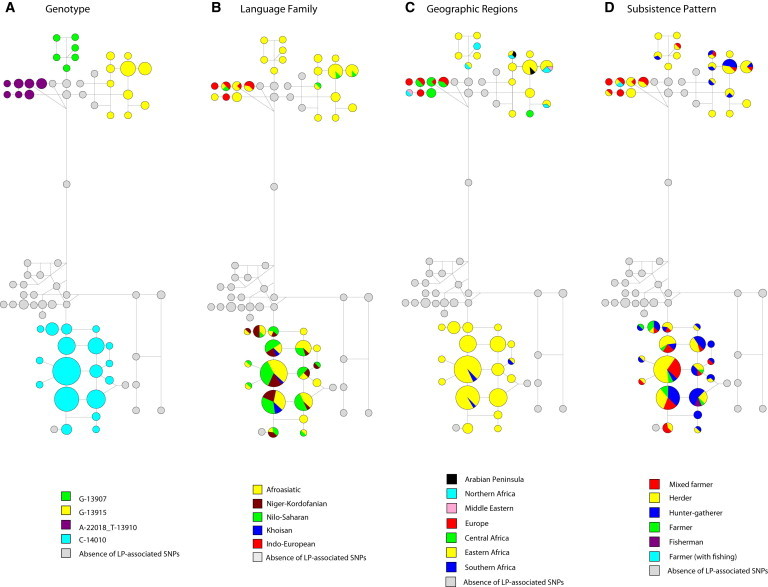
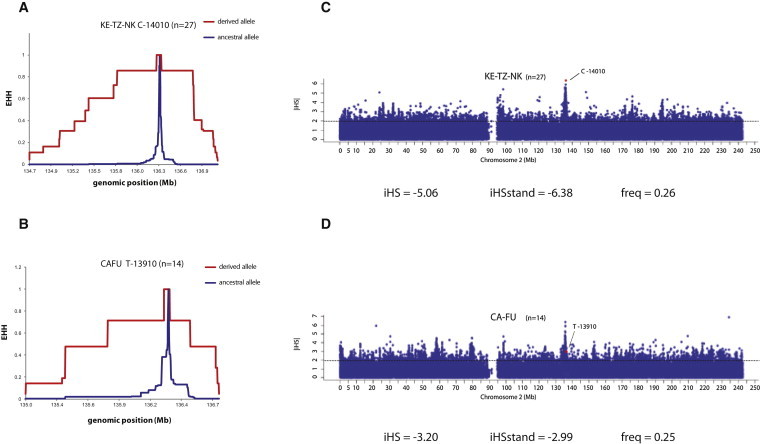
In humans, the ability to digest lactose, the sugar in milk, declines after weaning because of decreasing levels of the enzyme lactase-phlorizin hydrolase, encoded by LCT. However, some individuals maintain high enzyme amounts and are able to digest lactose into adulthood (i.e., they have the lactase-persistence [LP] trait). It is thought that selection has played a major role in maintaining this genetically determined phenotypic trait in different human populations that practice pastoralism. To identify variants associated with the LP trait and to study its evolutionary history in Africa, we sequenced MCM6 introns 9 and 13 and ~2 kb of the LCT promoter region in 819 individuals from 63 African populations and in 154 non-Africans from nine populations. We also genotyped four microsatellites in an ~198 kb region in a subset of 252 individuals to reconstruct the origin and spread of LP-associated variants in Africa. Additionally, we examined the association between LP and genetic variability at candidate regulatory regions in 513 individuals from eastern Africa. Our analyses confirmed the association between the LP trait and three common variants in intron 13 (C-14010, G-13907, and G-13915). Furthermore, we identified two additional LP-associated SNPs in intron 13 and the promoter region (G-12962 and T-956, respectively). Using neutrality tests based on the allele frequency spectrum and long-range linkage disequilibrium, we detected strong signatures of recent positive selection in eastern African populations and the Fulani from central Africa. In addition, haplotype analysis supported an eastern African origin of the C-14010 LP-associated mutation in southern Africa.


Figures

Figure 1
Figure 1
Enlarged Map of MCM6 and LCT, Located on Chromosome 2, and Locations of the Genomic Regions Sequenced and the Four Genotyped Microsatellites LCT and MCM6 have both been mapped to the long arm of chromosome 2 at position q21. Intron 13 of MCM6, upstream of LCT, carries the primary variants associated with the LP trait in the current study (C-14010, G-13915, T-13910, and G-13907), whereas intron 9 contains the A-22018 variant, which is in strong LD with T-13910 in Europeans and Africans. Relative positions of the four linked microsatellites and their repeat motifs typed in the study are also shown.
Figure 2
Figure 2
Map of the Allele Frequency Distribution of the LP-Associated SNPs in the Populations Analyzed in the Present Study Each dot represents a population included in the present study and is plotted on the map on the basis of its respective population’s geographic coordinates (Table S2). African populations are color coded on the basis of language family: Afroasiatic, red; Nilo-Saharan, yellow; Niger-Kordofanian, light blue; and Khoisan, green. All non-African populations are colored purple. Countries for which LTT phenotype data are available (Sudan, Tanzania, and Kenya) are shaded in orange, whereas those with no LTT data are shaded in gray. We only show histograms and relative frequencies for those populations that carry at least one of the five SNPs associated with the LP trait in humans.
Figure 3
Figure 3
Contour Maps of Africa Show the Allele Frequency Distribution for the Four Primary SNPs Associated with the LP Trait in the Current Study We visualized the frequency distribution of each of the SNPs (C-14010, G-13915, T-13910, and G-13907) associated with the LP trait in Africa as a contour map. The blue triangles represent locations of populations present in this study, whereas the red squares are the locations of populations in GLAD for Africa and Middle Eastern genotype data (Table S2).
Figure 4
Figure 4
Haplotype Network Inferred from SNPs and STRs Haplotype networks based on 56 SNPs identified in the sequenced regions and four fast-evolving linked microsatellites spanning a total of 197.8 kb for 252 individuals (Figure 1). Haplotypes are shown as circles, and the size of each circle is proportional to the number of individuals with a given haplotype. We assigned the same weight to SNPs and short tandem repeats, and the “frequency > 1” option was selected in the Network program (see Web Resources). Haplotypes are colored on the basis of genotype (A), linguistic family (B), geographic regions (C), and subsistence pattern (D).
Figure 5
Figure 5
EHH and iHS Analyses for Chromosomes Carrying the C-14010 and T-13910 Variants (A and B) EHH plots in Kenyan and Tanzanian Niger-Kordofanian speakers (KE-TZ-NK) (A) and in Fulani from Cameroon (CAFU) (B). Chromosomes containing the derived LP-associated alleles are colored in red, and those with the ancestral allele are colored in blue. Chromosomal positions are indicated on the x axes, and EHH values are indicated on the y axes. (C and D) The absolute values of standardized iHS (|iHS|) estimates are plotted against the genomic positions (NCBI Genome browser build 36.1) of SNPs at MCM6 and LCT promoter regions and the neighboring genetic regions on chromosome 2 in Kenyan and Tanzanian Niger-Kordofanian speakers (KE-TZ-NK) (C) and in the Fulani from Cameroon (CAFU) (D). The dots colored in red are the |iHS| estimates for the SNPs associated with the LP trait. The 95% cutoff value (1.96) of the empirical distribution of standardized iHS is given in each plot (dashed line). “iHS” stands for unstandardized iHS, and “iHS stand” stands for standardized iHS, as described by Voight et al.; “freq” indicates the frequency of the derived allele at the core SNP.

References

    1. Campbell A.K., Waud J.P., Matthews S.B. The molecular basis of lactose intolerance. Sci. Prog. 2005;88:157–202. - PMC - PubMed
    1. Cook G. Hypolactasia: geographical distribution, diagnosis, and pratical significance. In: Chandra R.K., editor. Volume 2. Plenum Press; New York: 1984. pp. 117–139. (Critical Reviews in Tropical Medicine).
    1. Holzel A., Schwarz V., Sutcliffe K.W. Defective lactose absorption causing malnutrition in infancy. Lancet. 1959;1:1126–1128. - PubMed
    1. Jacobi A. Milk-sugar in infant feeding. Transactions of the American Pediatric Society. 1901;13:150–160.
    1. Kretchmer N. Lactose and lactase—a historical perspective. Gastroenterology. 1971;61:805–813. - PubMed

Publication types

MeSH terms

Substances