. 2014 Jul;72(100):104-16.
doi: 10.1016/j.yjmcc.2014.03.002. Epub 2014 Mar 12.

Targeted deletion of ERK2 in cardiomyocytes attenuates hypertrophic response but provokes pathological stress induced cardiac dysfunction

Affiliations

Targeted deletion of ERK2 in cardiomyocytes attenuates hypertrophic response but provokes pathological stress induced cardiac dysfunction

Susanne Ulm et al. J Mol Cell Cardiol. 2014 Jul.

Abstract

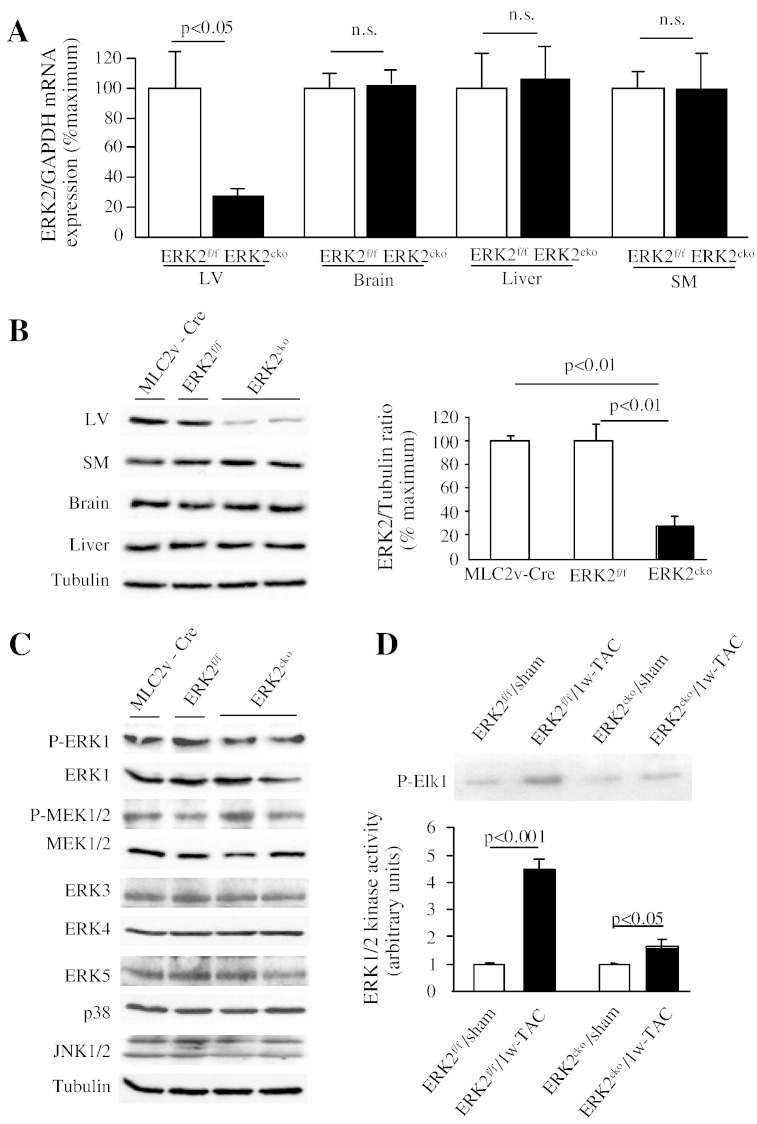
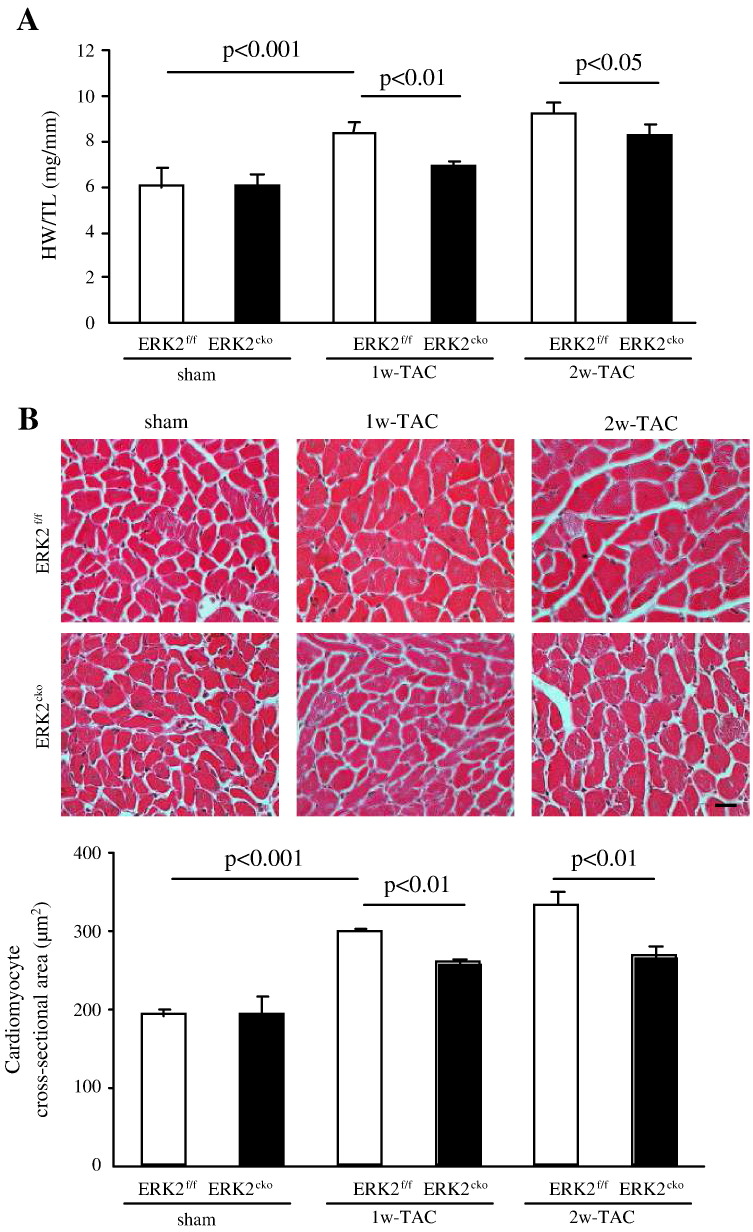
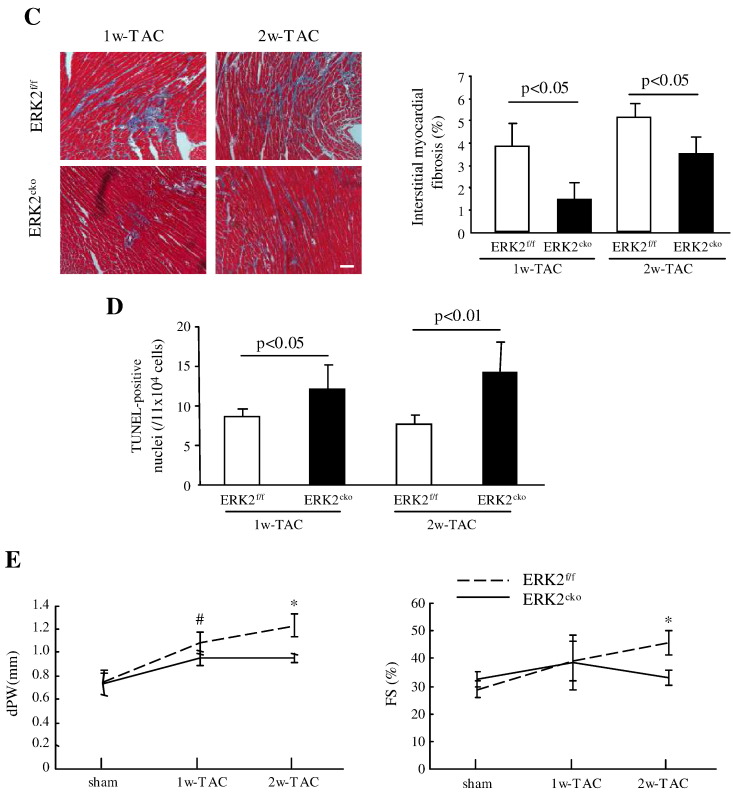
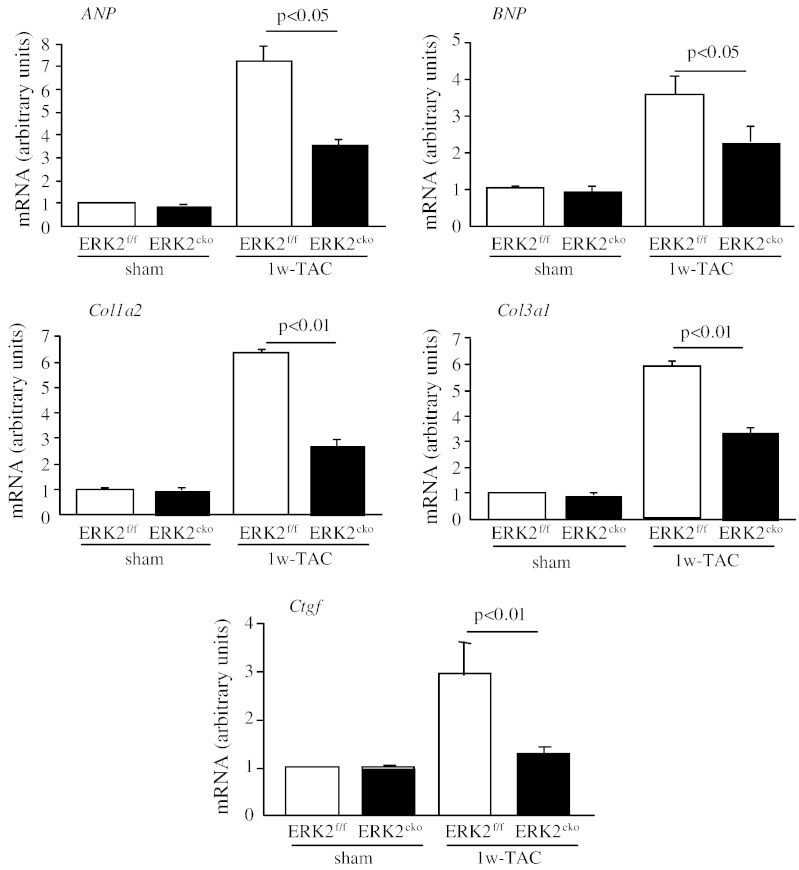
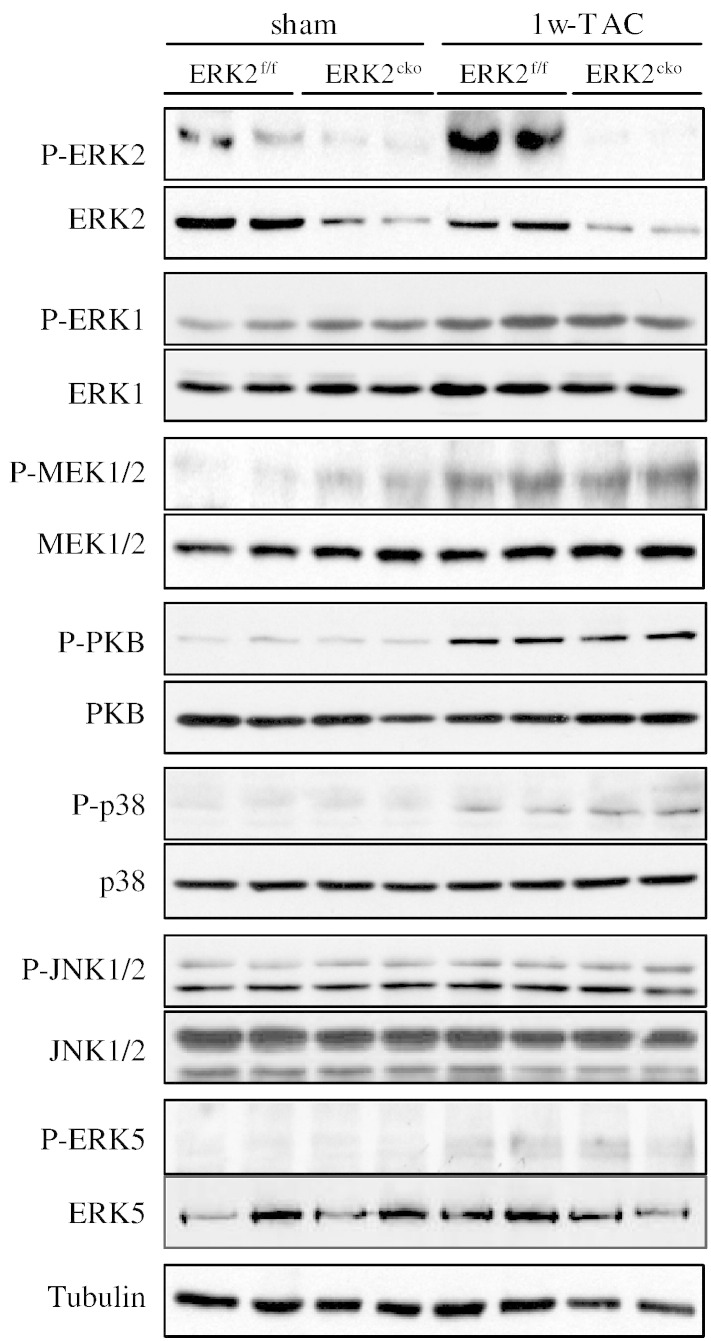
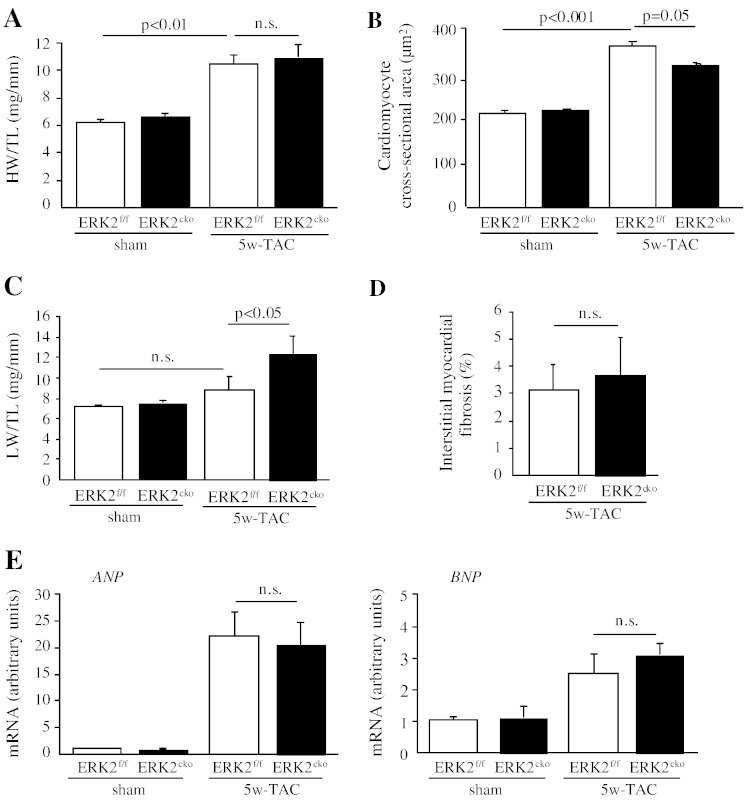
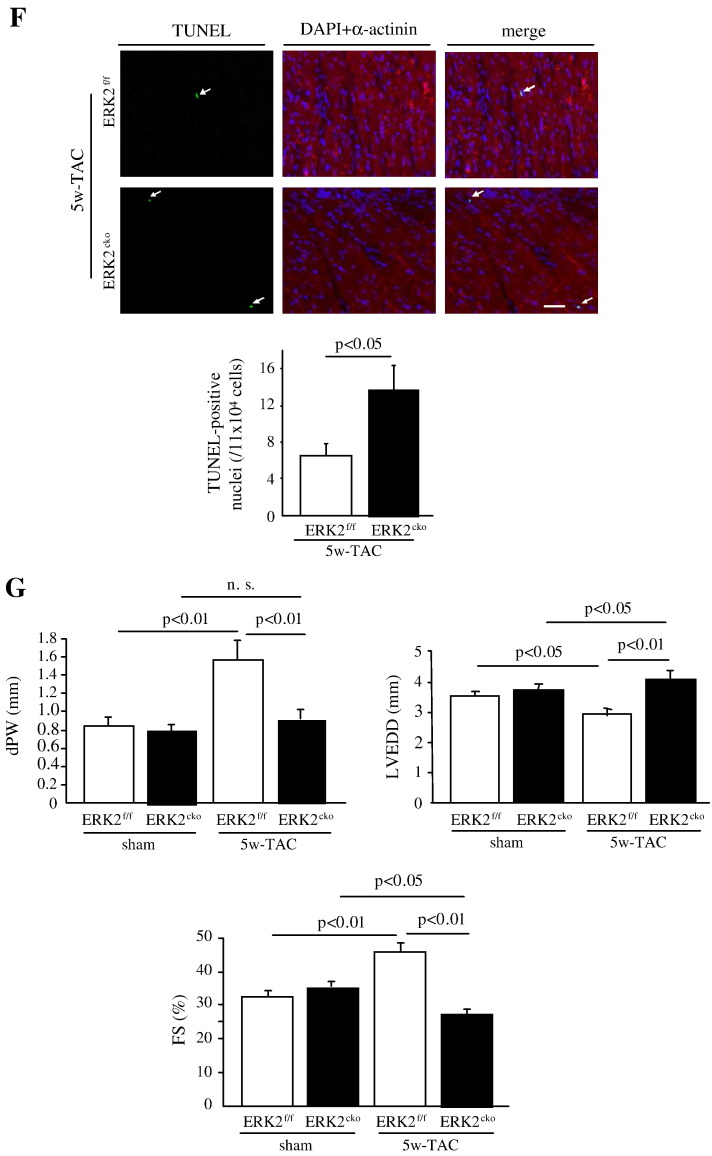
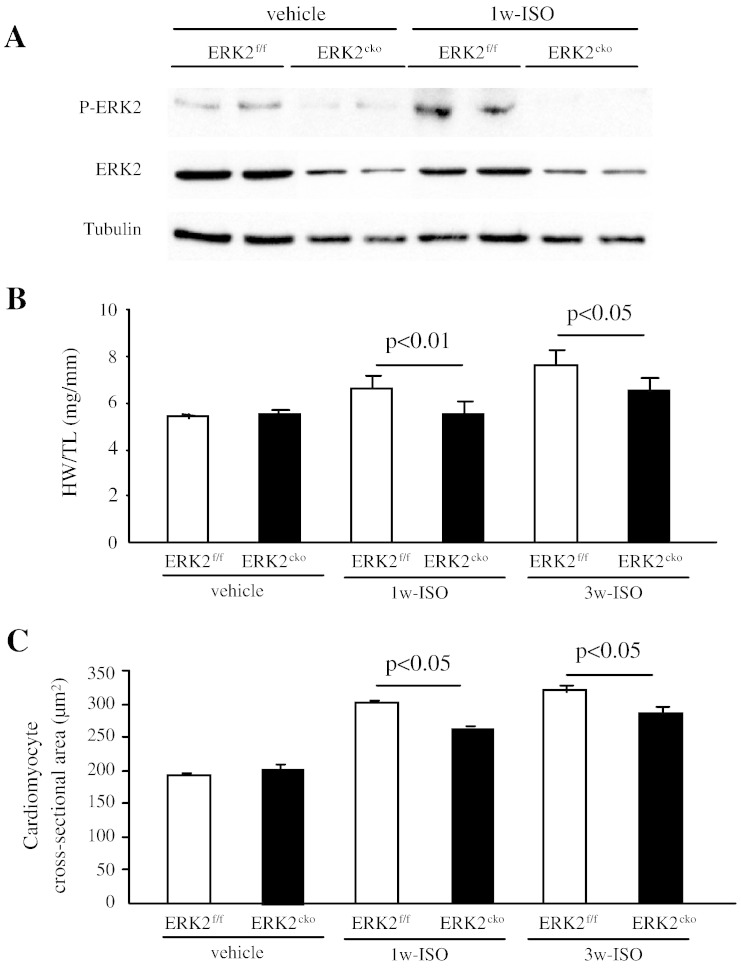
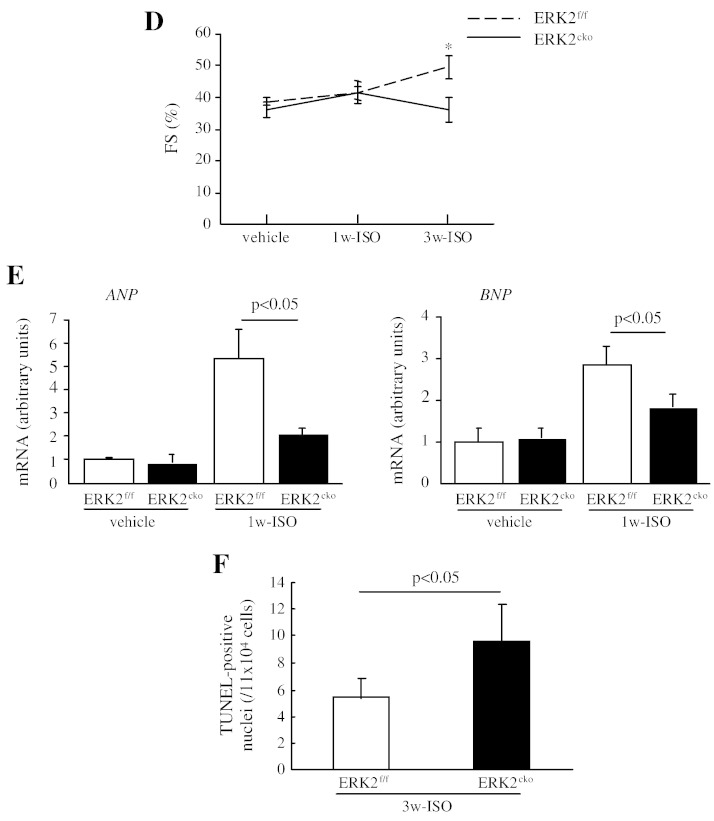
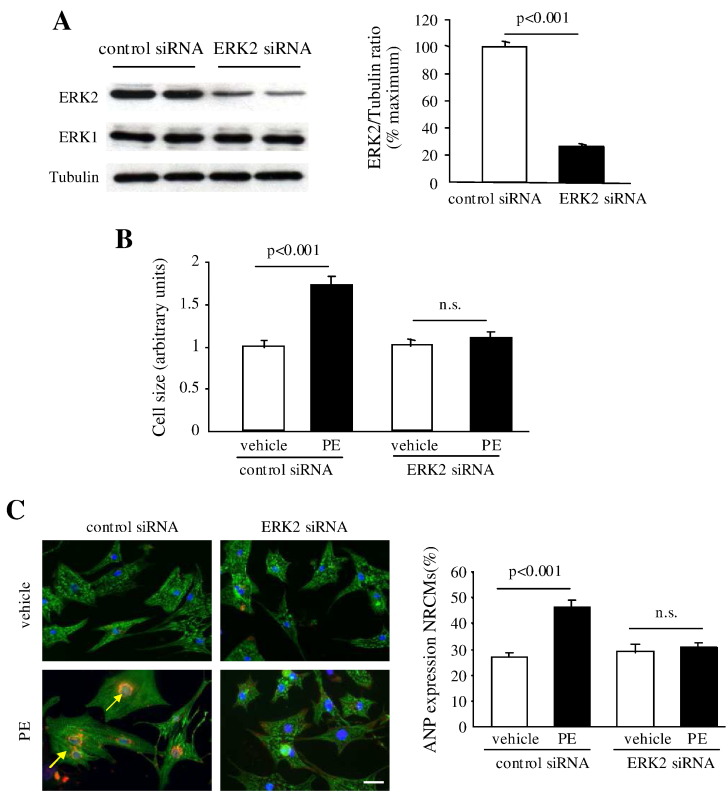
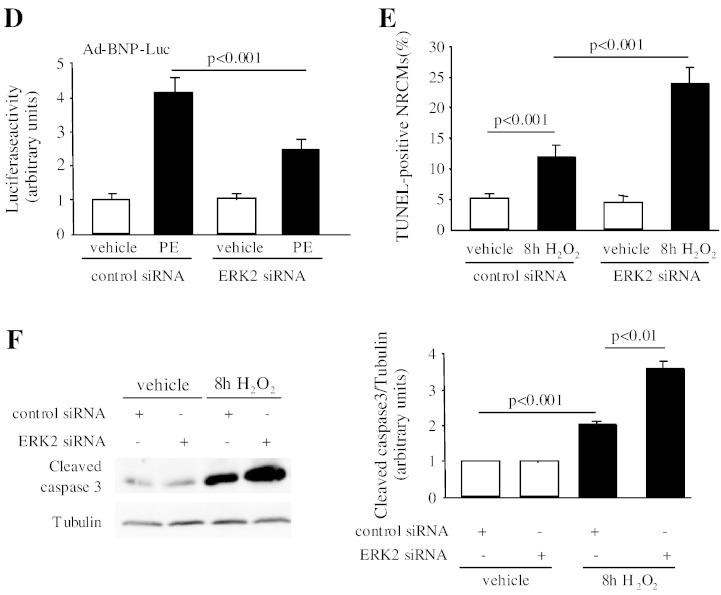
Mitogen-activated protein kinases (MAPKs) are involved in the regulation of cardiac hypertrophy and myocyte survival. Extracellular signal regulated protein kinase 1 and 2 (ERK1/2) are key components in the MAPK signaling pathways. Dysfunction of ERK1/2 in congenital heart diseases (Noonan syndrome and LEOPARD syndrome) leads to cardiac hypertrophy. ERK2 contributes 70% of protein content to total ERK1/2 content in myocardium; however, the specific role of ERK2 in regulating cardiac hypertrophy is yet to be further defined. To investigate the specific role of ERK2 played in the cardiomyocytes, we generated and examined mice with cardiomyocyte-specific deletion of the erk2 gene (ERK2(cko) mice). Following short-term pathological hypertrophic stresses, the mutant mice showed attenuated hypertrophic remodeling characterized by a blunted increase in the cross-sectional area of individual myocytes, downregulation of hypertrophic foetal gene markers (ANP and BNP), and less interstitial fibrosis. However, increased cardiomyocyte apoptosis was observed. Upon prolonged stimulation, ERK2(cko) mice developed deterioration in cardiac function. However, absence of ERK2 did not affect physiological hypertrophy induced by 4weeks of swimming exercise. These results revealed an essential role for ERK2 in cardiomyocytes in the development of pathological hypertrophic remodeling and resistance to cell death.

Keywords: Apoptosis; Cardiac hypertrophy; Genetically modified mice; Interstitial fibrosis; Signal transduction.


Figures

Fig. 1
Fig. 1
Characterisation of cardiomyocyte-specific deletion of ERK2. (A) Quantitative real-time PCR analysis of mRNA levels of ERK2 in the left ventricle (LV), skeletal muscle (SM), brain, and liver. A 73% decrease in mRNA level was shown only in LV of ERK2cko mice in comparison to ERK2f/f mice. Data were derived from 3 independent experiments performed in triplicate and normalized to GAPDH content (n = 3). (B) Immunoblot analysis confirmed specificity of ERK2 deletion in LV. ERK2 protein expression was comparable in various tissues. Tubulin served as protein loading control. The ratio of ERK2 expression to tubulin is shown in the bar graph. (C) Western blot analyses demonstrated unchanged activation and expression levels of ERK1 and MEK1/2. Expression of ERK3, ERK4, ERK5, p38 and JNK in ventricular extracts was the same in all genotypes. Tubulin served as protein loading control. (D) ERK1/2 kinase activity was examined on the tissue subjected to 1 week of TAC, demonstrating ERK1 activation did not compensate the loss of ERK2 in the heart (n = 5). n.s.: no significant difference. Data presented as mean ± SEM.
Fig. 2
Fig. 2
Attenuated hypertrophic response in ERK2cko mice following short-term TAC. (A) HW/TL ratios of ERK2f/f and ERK2cko mice were calculated following sham or TAC treatment. (B) ERK2cko mice developed less hypertrophy after 1 or 2 weeks of TAC. Haematoxylin/eosin staining of ventricular cross-sections (top panel, scale = 20 μm). The measurement of mean cross-sectional area showed less enlarged ERK2cko cardiomyocytes (lower panel). (C) Masson's trichrome staining of the hearts demonstrated less interstitial ventricular fibrosis in ERK2cko-TAC hearts (scale = 50 μm). Quantification of the relative area of fibrosis is expressed as a percentage of the fibrosis area in the microscope view. (D) The bar graph summarizes the number of apoptotic nuclei in ERK2cko ventricles compared to that in ERK2f/f ventricles after 1w- or 2w-TAC. (E) Parameters of end-diastolic left ventricular posterior wall thickness (dPW) and fractional shortening (FS%) were shown to demonstrate cardiac function. n = 7. # or *, P < 0.05 ERK2cko versus ERK2f/f. Data presented as mean ± SEM.
Fig. 2
Fig. 2
Attenuated hypertrophic response in ERK2cko mice following short-term TAC. (A) HW/TL ratios of ERK2f/f and ERK2cko mice were calculated following sham or TAC treatment. (B) ERK2cko mice developed less hypertrophy after 1 or 2 weeks of TAC. Haematoxylin/eosin staining of ventricular cross-sections (top panel, scale = 20 μm). The measurement of mean cross-sectional area showed less enlarged ERK2cko cardiomyocytes (lower panel). (C) Masson's trichrome staining of the hearts demonstrated less interstitial ventricular fibrosis in ERK2cko-TAC hearts (scale = 50 μm). Quantification of the relative area of fibrosis is expressed as a percentage of the fibrosis area in the microscope view. (D) The bar graph summarizes the number of apoptotic nuclei in ERK2cko ventricles compared to that in ERK2f/f ventricles after 1w- or 2w-TAC. (E) Parameters of end-diastolic left ventricular posterior wall thickness (dPW) and fractional shortening (FS%) were shown to demonstrate cardiac function. n = 7. # or *, P < 0.05 ERK2cko versus ERK2f/f. Data presented as mean ± SEM.
Fig. 3
Fig. 3
Quantitative real-time PCR analyses of hypertrophic gene markers and fibrosis gene markers. ANP or BNP and Col1α2, Col3α1 or Ctgf. Data derived from 3 independent experiments performed in triplicate and normalized to GAPDH content (n = 3). Data presented as mean ± SEM.
Fig. 4
Fig. 4
Analysis of hypertrophic regulators in ERK2f/f and ERK2cko ventricles. Protein extracts from ERK2f/f and ERK2cko ventricles after 1 week of sham or TAC operation were subjected to immunoblot analyses for total ERK2, ERK1, MEK1/2, PKB, p38, JNK and ERK5 expression as well as their phosphorylation levels using specific antibodies.
Fig. 5
Fig. 5
ERK2cko mice were prone to heart failure after prolonged pressure overload. (A) After 5 weeks of TAC, ERK2f/f and ERK2cko mice both showed increased HW/TL ratio compared to sham operated groups. (B) The measurement of mean cross-sectional area showed blunted ERK2cko cardiomyocytes. (C) ERK2cko mice showed significantly increased lung weight/tibia length (LW/TL) ratio. (D) Quantification of interstitial ventricular fibrosis in ERK2f/f and ERK2cko mice. (E) Quantitative real-time PCR analyses of ANP and BNP. Data derived from 3 independent experiments performed in triplicate and normalized to GAPDH content. (F) Augmented apoptosis in ERK2cko ventricular cardiomyocytes was detected by TUNEL assay (arrows indicate TUNEL positive nuclei, scale = 100 μm). Triple staining was performed: TUNEL (green), DAPI (blue), α-actinin (red). (G) M-mode echocardiography of ERK2f/f and ERK2cko mice following sham or TAC revealed detrimental cardiac dysfunction in ERK2cko 5w-TAC group. dPW, left ventricular end-diastolic dimension (LVEDD), and FS% are shown. n = 9 to 10. n.s.: no significant difference. Data presented as means ± SEM.
Fig. 5
Fig. 5
ERK2cko mice were prone to heart failure after prolonged pressure overload. (A) After 5 weeks of TAC, ERK2f/f and ERK2cko mice both showed increased HW/TL ratio compared to sham operated groups. (B) The measurement of mean cross-sectional area showed blunted ERK2cko cardiomyocytes. (C) ERK2cko mice showed significantly increased lung weight/tibia length (LW/TL) ratio. (D) Quantification of interstitial ventricular fibrosis in ERK2f/f and ERK2cko mice. (E) Quantitative real-time PCR analyses of ANP and BNP. Data derived from 3 independent experiments performed in triplicate and normalized to GAPDH content. (F) Augmented apoptosis in ERK2cko ventricular cardiomyocytes was detected by TUNEL assay (arrows indicate TUNEL positive nuclei, scale = 100 μm). Triple staining was performed: TUNEL (green), DAPI (blue), α-actinin (red). (G) M-mode echocardiography of ERK2f/f and ERK2cko mice following sham or TAC revealed detrimental cardiac dysfunction in ERK2cko 5w-TAC group. dPW, left ventricular end-diastolic dimension (LVEDD), and FS% are shown. n = 9 to 10. n.s.: no significant difference. Data presented as means ± SEM.
Fig. 6
Fig. 6
ERK2 mediated cardiac hypertrophy induced by isoproterenol. (A) Following 1 week of ISO stimulation, immunoblot analysis revealed that the activation of ERK2 was increased in normal heart. (B) ERK2cko mice showed less enlargement of the HW/TL ratio compared to control 1w- or 3w-ISO treated group. (C) The quantification of haematoxylin/eosin staining of ventricular cross-sections also displayed less cardiac hypertrophic growth in ERK2cko hearts. (D) FS% indicated the reduced cardiac function in ERK2cko following 3 weeks of ISO. n = 6. *, P < 0.05 ERK2cko versus ERK2f/f. (E) Real-time PCR analyses indicating lower level of ANP and BNP mRNA expression in ERK2cko 1w-ISO ventricles. Data were derived from 3 independent experiments performed in triplicate and normalized to GAPDH content (n = 3). (F) Increased apoptosis in ERK2cko cardiomyocytes after 3 weeks of ISO stimulation by TUNEL assay. n = 5. Data presented as means ± SEM.
Fig. 6
Fig. 6
ERK2 mediated cardiac hypertrophy induced by isoproterenol. (A) Following 1 week of ISO stimulation, immunoblot analysis revealed that the activation of ERK2 was increased in normal heart. (B) ERK2cko mice showed less enlargement of the HW/TL ratio compared to control 1w- or 3w-ISO treated group. (C) The quantification of haematoxylin/eosin staining of ventricular cross-sections also displayed less cardiac hypertrophic growth in ERK2cko hearts. (D) FS% indicated the reduced cardiac function in ERK2cko following 3 weeks of ISO. n = 6. *, P < 0.05 ERK2cko versus ERK2f/f. (E) Real-time PCR analyses indicating lower level of ANP and BNP mRNA expression in ERK2cko 1w-ISO ventricles. Data were derived from 3 independent experiments performed in triplicate and normalized to GAPDH content (n = 3). (F) Increased apoptosis in ERK2cko cardiomyocytes after 3 weeks of ISO stimulation by TUNEL assay. n = 5. Data presented as means ± SEM.
Fig. 7
Fig. 7
Knockdown of ERK2 diminished hypertrophic growth and promoted apoptosis in neonatal rat cardiomyocytes (NRCMs). (A) Western blot analysis showed that expression of ERK2 was decreased by transfection of rat ERK2 siRNA. (B) Cardiomyocyte cell size was not increased in NRCMs transfected with ERK2 siRNA following PE administration for 48 h. (C) Representative images of triple staining of NRCMs (red staining for ANP [arrows], green for α-actinin, and blue for DAPI, scale bar = 20 μm). Quantification of ANP expression in NRCMs is presented by the graph. (D) ERK2 siRNA treated NRCMs displayed blunted BNP reporter activity compared to the significantly increased activity in control NRCMs after PE treatment. (E) Enhanced apoptosis levels were detected in ERK2 siRNA transfected NRCMs following 100 μM H2O2 treatment for 8 h by TUNEL assay. The bar graphs represent the number of apoptotic nuclei. (F) Immunoblot analysis of protein levels of active caspase 3. Tubulin expression is the protein loading control. The ratio of active caspase 3 to tubulin was dramatically increased in the NRCMs with loss of ERK2 after 8 h treatment of H2O2. n = 5. n.s.: no significant difference. Data presented as mean ± SEM.
Fig. 7
Fig. 7
Knockdown of ERK2 diminished hypertrophic growth and promoted apoptosis in neonatal rat cardiomyocytes (NRCMs). (A) Western blot analysis showed that expression of ERK2 was decreased by transfection of rat ERK2 siRNA. (B) Cardiomyocyte cell size was not increased in NRCMs transfected with ERK2 siRNA following PE administration for 48 h. (C) Representative images of triple staining of NRCMs (red staining for ANP [arrows], green for α-actinin, and blue for DAPI, scale bar = 20 μm). Quantification of ANP expression in NRCMs is presented by the graph. (D) ERK2 siRNA treated NRCMs displayed blunted BNP reporter activity compared to the significantly increased activity in control NRCMs after PE treatment. (E) Enhanced apoptosis levels were detected in ERK2 siRNA transfected NRCMs following 100 μM H2O2 treatment for 8 h by TUNEL assay. The bar graphs represent the number of apoptotic nuclei. (F) Immunoblot analysis of protein levels of active caspase 3. Tubulin expression is the protein loading control. The ratio of active caspase 3 to tubulin was dramatically increased in the NRCMs with loss of ERK2 after 8 h treatment of H2O2. n = 5. n.s.: no significant difference. Data presented as mean ± SEM.

References

    1. Hill J.A., Olson E.N. Cardiac plasticity. N Engl J Med. 2008;358:1370–1380. - PubMed
    1. Maron B.J. Hypertrophic cardiomyopathy in childhood. Pediatr Clin North Am. 2004;51:1305–1346. - PubMed
    1. Ogata T., Yoshida R. PTPN11 mutations and genotype-phenotype correlations in Noonan and LEOPARD syndromes. Pediatr Endocrinol Rev. 2005;2:669–674. - PubMed
    1. Burch M., Sharland M., Shinebourne E., Smith G., Patton M., McKenna W. Cardiologic abnormalities in Noonan syndrome: phenotypic diagnosis and echocardiographic assessment of 118 patients. J Am Coll Cardiol. 1993;22:1189–1192. - PubMed
    1. Tartaglia M., Mehler E.L., Goldberg R., Zampino G., Brunner H.G., Kremer H. Mutations in PTPN11, encoding the protein tyrosine phosphatase SHP-2, cause Noonan syndrome. Nat Genet. 2001;29:465–468. - PubMed

Publication types

MeSH terms

Substances

LinkOut - more resources