

Validation of an integrated method for determining cognitive ability: Implications for routine assessments and clinical trials
- PMID: 24632464
- PMCID: PMC4737650
- DOI: 10.1016/j.cortex.2014.01.016
Validation of an integrated method for determining cognitive ability: Implications for routine assessments and clinical trials
Abstract
Introduction: Although accurate diagnosis of deficit of mild intensity is critical, various methods are used to assess, dichotomize and integrate performance, with no validated gold standard. This study described and validated a framework for the analysis of cognitive performance.
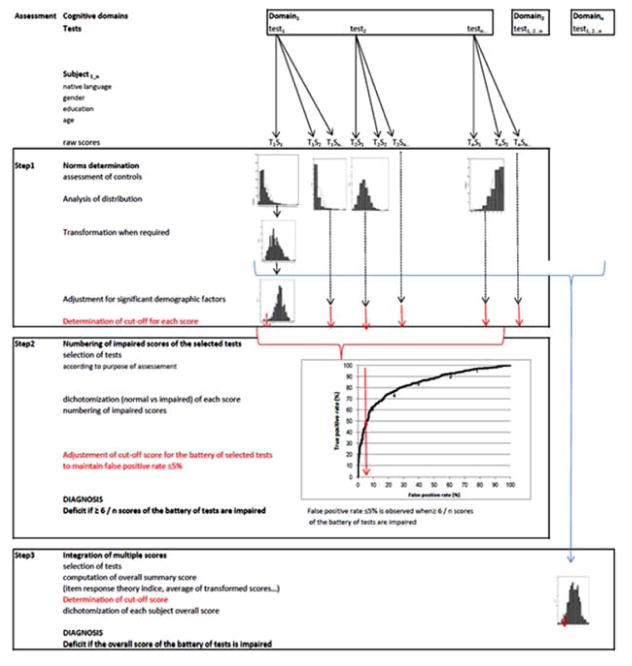
Methods: This study was performed by using the Groupe de Réflexion sur L'Evaluation des Fonctions EXécutives (GREFEX) database (724 controls and 461 patients) examined by 7 tests assessing executive functions. The first phase determined the criteria for the cutoff scores, the second phase, the effect of test number on diagnostic accuracy and the third phase, the best methods for combining test scores into an overall summary score. Four validation criteria were used: determination of impaired performance as compared to expected one, false-positive rate ≤5%, detection of both single and multiple impairments with optimal sensitivity.
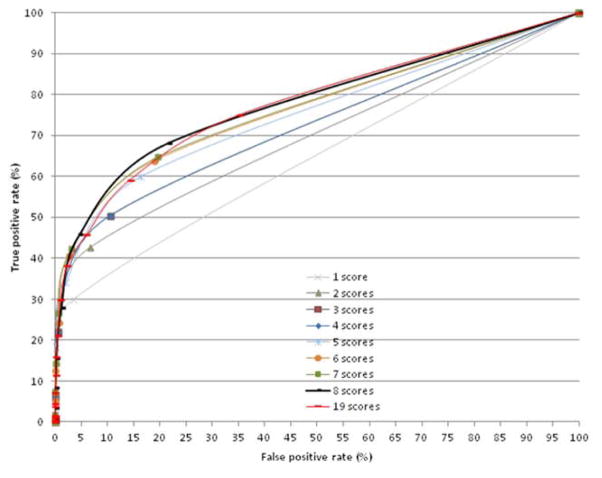
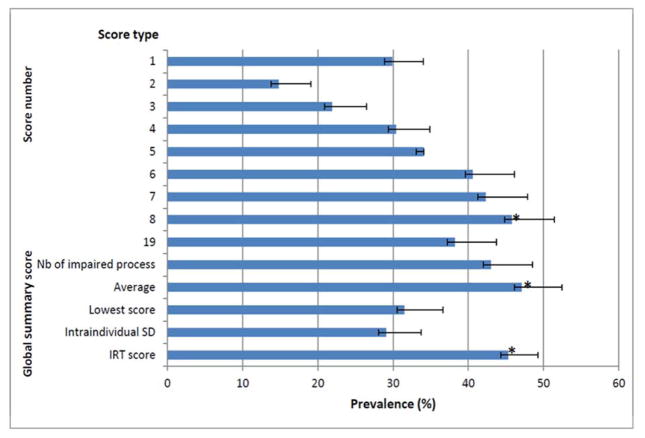
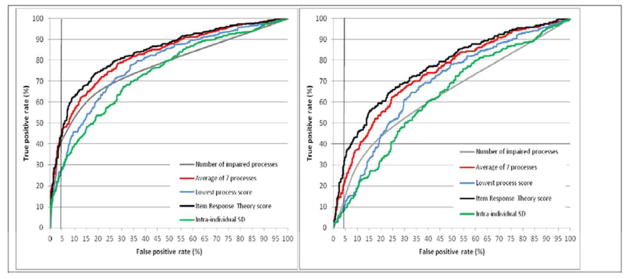
Results: The procedure based on 5th percentile cutoffs determined from standardized residuals was the most appropriate procedure. Although area under the curve (AUC) increased with the number of scores (p = .0001), the false-positive rate also increased (p = .0001), resulting in suboptimal sensitivity for detecting selective impairment. Two overall summary scores, the average of the seven process scores and the Item Response Theory (IRT) score, had significantly (p = .0001) higher AUCs, even for patients with a selective impairment, and provided higher resulting prevalence of dysexecutive disorders (p = .0001).
Conclusions: The present study provides and validates a generative framework for the interpretation of cognitive data. Two overall summary score met all 4 validation criteria. A practical consequence is the need to profoundly modify the analysis and interpretation of cognitive assessments for both routine use and clinical research.
Keywords: Dementia; Diagnostic accuracy; Executive functions; Mild cognitive impairment; Stroke; sensitivity and specificity.
Copyright © 2014 Elsevier Ltd. All rights reserved.
Figures
References
-
- Adams RJ, Wilson Mark, Wang Wen-chung. The Multidimensional Random Coefficients Multinomial Logit Model. Appl Psych Meas. 1997;21:1–23.
-
- Baddeley AD, Logie RH, Bressi S, Della Sala S, Spinnler H. Dementia and working memory. Quart J Exp Psychol. 1986;38A:603–618. - PubMed
-
- Bateman RJ, Xiong C, Benzinger TL, Fagan AM, Goate A, Fox NC, Marcus DS, Cairns NJ, Xie X, Blazey TM, Holtzman DM, Santacruz A, Buckles V, Oliver A, Moulder K, Aisen PS, Ghetti B, Klunk WE, McDade E, Martins RN, Masters CL, Mayeux R, Ringman JM, Rossor MN, Schofield PR, Sperling RA, Salloway S, Morris JC Dominantly Inherited Alzheimer Network. Clinical and biomarker changes in dominantly inherited Alzheimer’s disease. N Engl J Med. 2012;367:795–804. - PMC - PubMed
-
- Box GEP, Cox DR. An analysis of transformations. J R Stat Soc B. 1964;26:211–252.
Publication types
MeSH terms
Grants and funding
LinkOut - more resources
Full Text Sources
Other Literature Sources
Miscellaneous
