. 2014 Mar 14;9(3):e91848.
doi: 10.1371/journal.pone.0091848. eCollection 2014.

Deregulation of mitochondria-shaping proteins Opa-1 and Drp-1 in manganese-induced apoptosis

Affiliations

Deregulation of mitochondria-shaping proteins Opa-1 and Drp-1 in manganese-induced apoptosis

Agustina Alaimo et al. PLoS One. .

Abstract

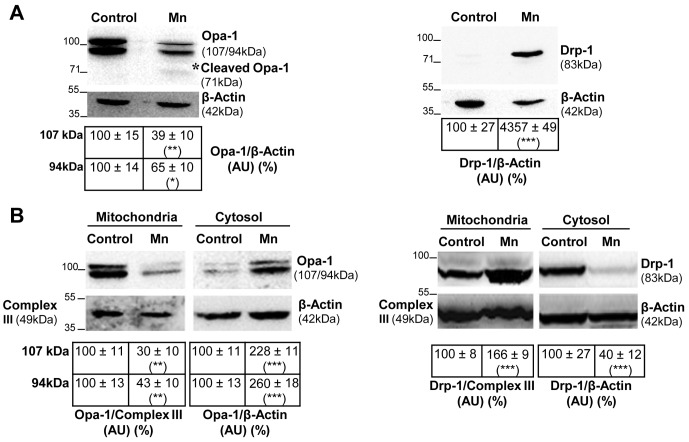
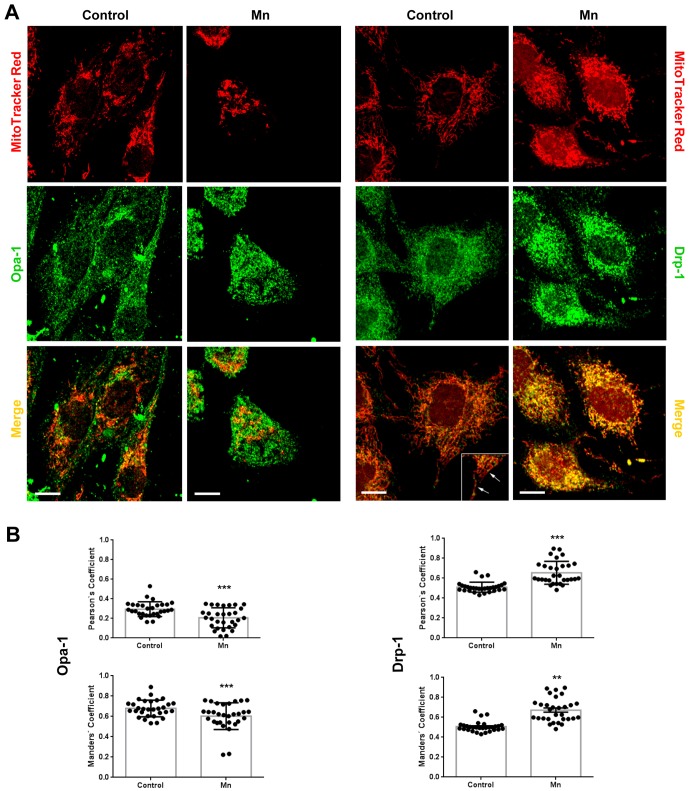
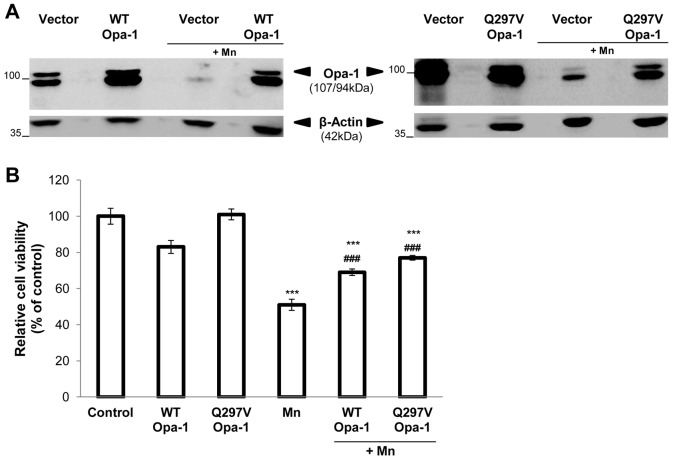
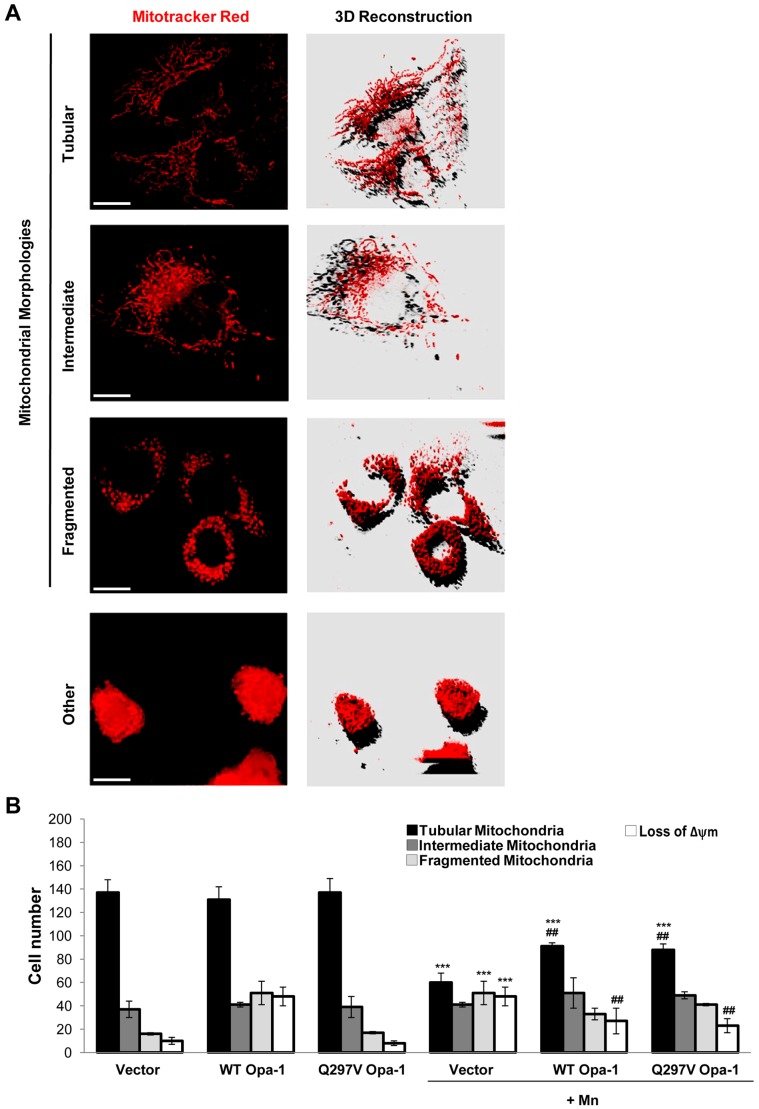
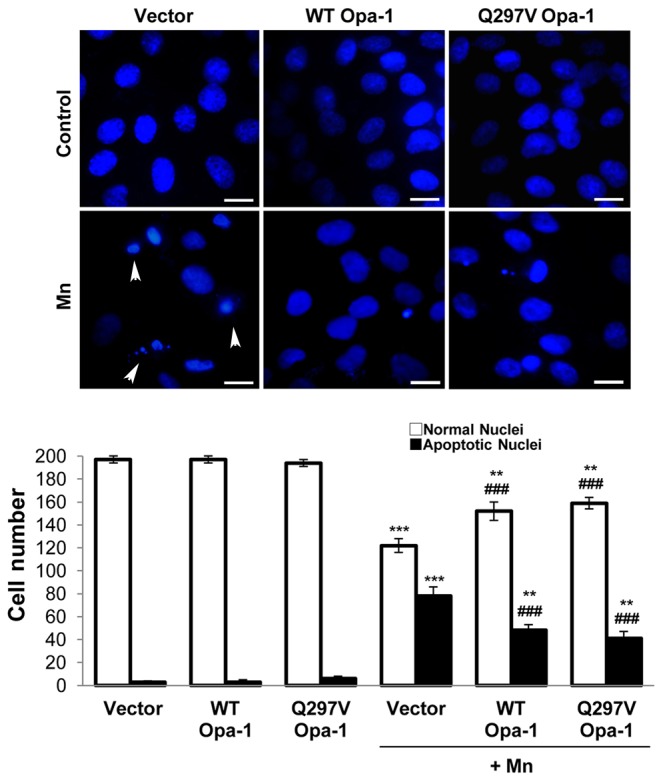
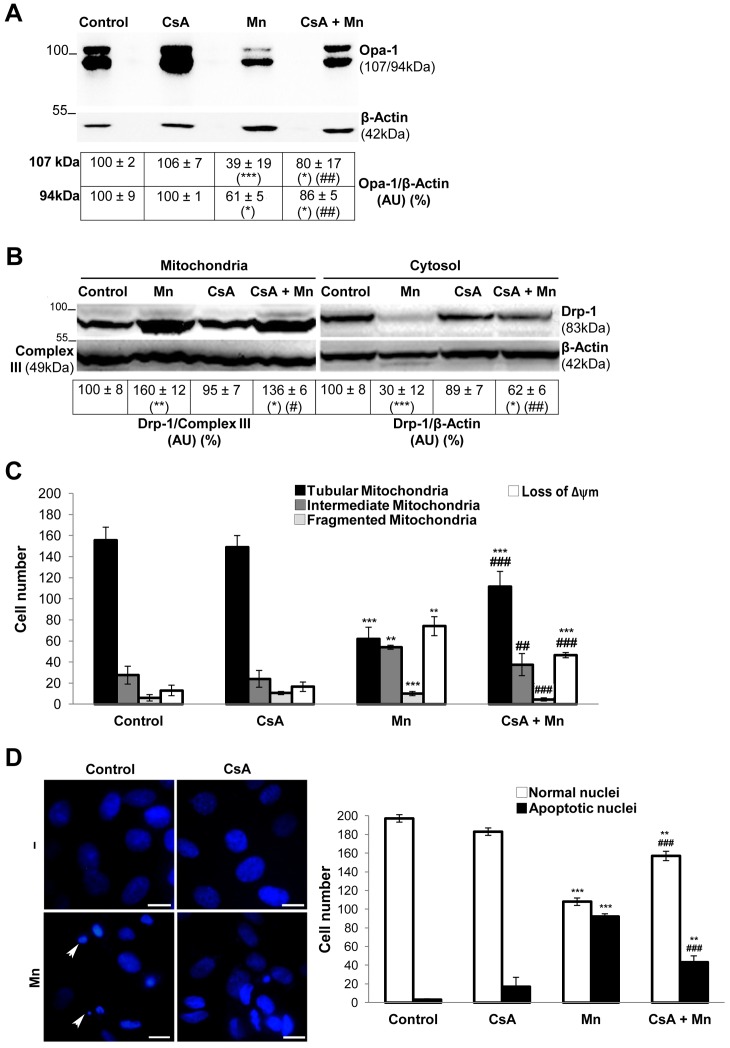
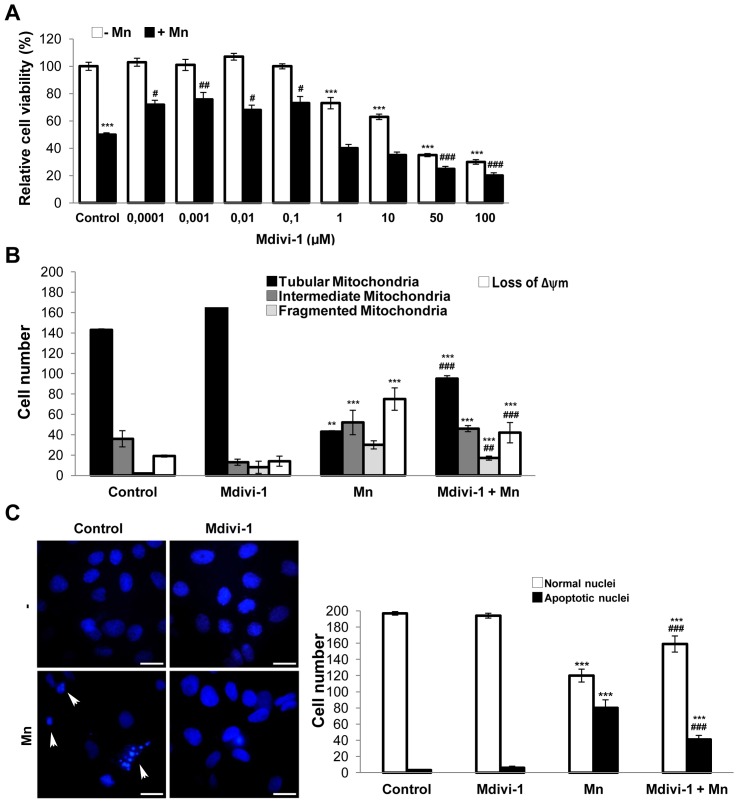
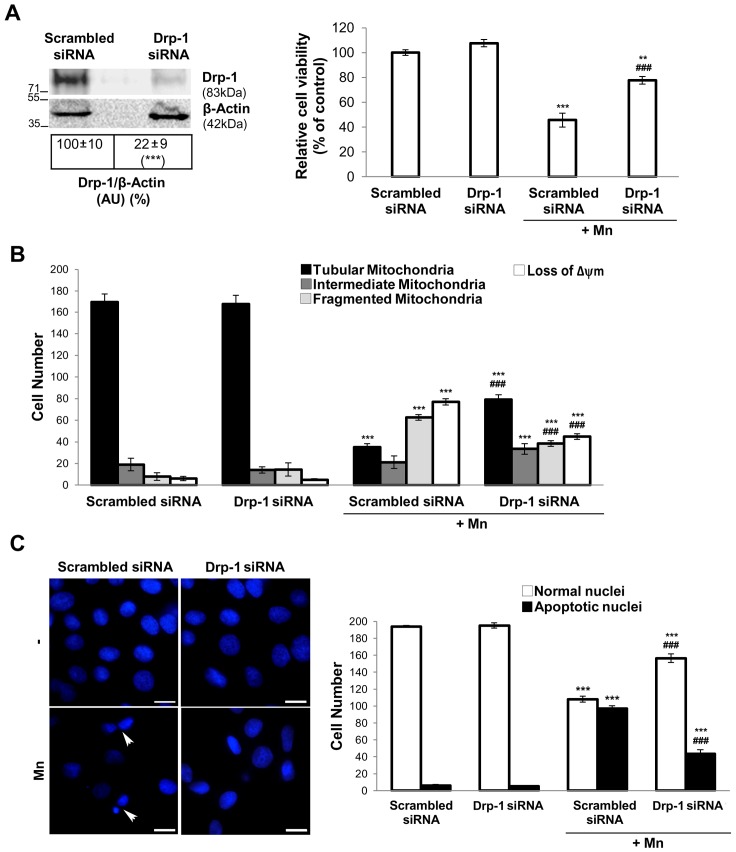
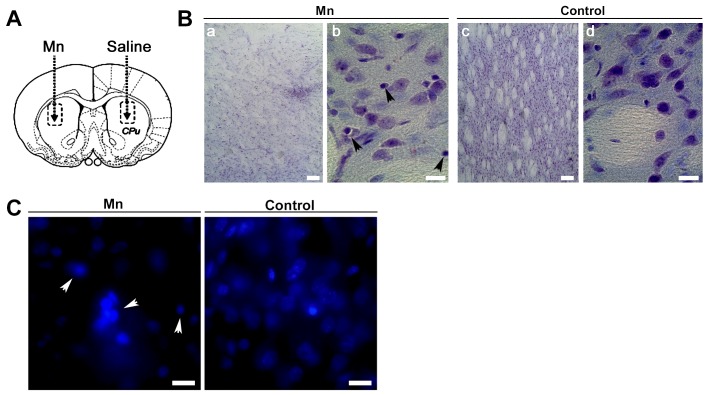
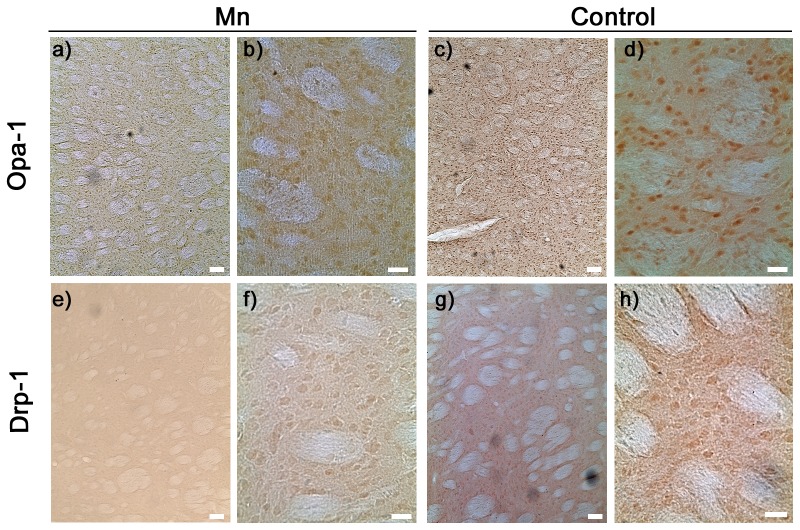
Mitochondria are dynamic organelles that undergo fusion and fission processes. These events are regulated by mitochondria-shaping proteins. Changes in the expression and/or localization of these proteins lead to a mitochondrial dynamics impairment and may promote apoptosis. Increasing evidence correlates the mitochondrial dynamics disruption with the occurrence of neurodegenerative diseases. Therefore, we focused on this topic in Manganese (Mn)-induced Parkinsonism, a disorder associated with Mn accumulation preferentially in the basal ganglia where mitochondria from astrocytes represent an early target. Using MitoTracker Red staining we observed increased mitochondrial network fission in Mn-exposed rat astrocytoma C6 cells. Moreover, Mn induced a marked decrease in fusion protein Opa-1 levels as well as a dramatic increase in the expression of fission protein Drp-1. Additionally, Mn provoked a significant release of high MW Opa-1 isoforms from the mitochondria to the cytosol as well as an increased Drp-1 translocation to the mitochondria. Both Mdivi-1, a pharmacological Drp-1 inhibitor, and rat Drp-1 siRNA reduced the number of apoptotic nuclei, preserved the mitochondrial network integrity and prevented cell death. CsA, an MPTP opening inhibitor, prevented mitochondrial Δψm disruption, Opa-1 processing and Drp-1 translocation to the mitochondria therefore protecting Mn-exposed cells from mitochondrial disruption and apoptosis. The histological analysis and Hoechst 33258 staining of brain sections of Mn-injected rats in the striatum showed a decrease in cellular mass paralleled with an increase in the occurrence of apoptotic nuclei. Opa-1 and Drp-1 expression levels were also changed by Mn-treatment. Our results demonstrate for the first time that abnormal mitochondrial dynamics is implicated in both in vitro and in vivo Mn toxicity. In addition we show that the imbalance in fusion/fission equilibrium might be involved in Mn-induced apoptosis. This knowledge may provide new therapeutic tools for the treatment of Manganism and other neurodegenerative diseases.


Conflict of interest statement

Competing Interests: The authors have declared that no competing interests exist.

Figures

Figure 1
Figure 1. Altered expression and subcellular distribution of mitochondrial fusion/fission proteins in Mn-treated C6 cells.
Opa-1 and Drp-1 expression levels. Monoclonal antibodies that recognize Opa-1 or Drp-1 were used for immunoblotting analysis of total cell lysates. Reprobing with an anti-β-Actin antibody was performed to normalize for protein loading. Signals were quantified with the Image J software. Images correspond to one representative experiment (n = 3). Results are expressed as a percentage of the respective control considered as 100%. Asterisk [*] denotes Opa-1 cleavage product with a MW ∼71 kDa (A); Enriched-mitochondrial and cytosolic fractions were subjected to immunoblotting procedure using antibodies that recognize Opa-1 or Drp-1 proteins. Reprobing with anti-Complex III subunit core 1- OxPhos (Complex III) and anti-β-Actin antibodies was performed to normalize for loading control. Images correspond to one representative experiment (n = 2). Results are expressed as a percentage of the respective control considered as 100% (B). Statistically significant differences between the controls and experimental groups are indicated by: *p<0.05, **p<0.01 and ***p<0.001 vs. control. AU: Arbitrary Units.
Figure 2
Figure 2. Opa-1 and Drp-1 immunocytochemistry.
Representative confocal microscopy images obtained in separate experiments (n = 2) Scale bar: 10 µm (A); Scatter plots of Pearson’s and Manders’ coefficients. Statistical significance, **p<0.01 and ***p<0.001 vs. control (B).
Figure 3
Figure 3. WT and Q297V Opa-1 (disassembly-resistant mutant) over- expression result in cell death reduction.
C6 cells were transiently transfected with empty pcDNA3 vector (control) or vectors encoding WT or Q297V Opa-1, grown for 24 hours and then exposed to Mn for additional 24 hours. Western Blot of total lysates from transfected cells (A); Cell viability determined by MTT assay (B). Statistical significance, ***p<0.001 vs. control and ###p<0.001 vs. Mn.
Figure 4
Figure 4. WT and Q297V Opa-1 over-expression maintain the mitochondrial tubular network.
Mitochondria were visualized with MitoTracker Red CMXRos (75 nM) under a fluorescence microscope. Representative images acquired and deconvoluted are shown. Scale bar: 10 µm. Three categories of cells exhibiting different mitochondrial morphology were scored: tubular mitochondria (normal), intermediate mitochondria (filamentous with swelling regions) and fragmented (globular). Cells classified as “loss of Δψm” refers to those exhibiting nuclear condensation and Δψm collapse (A); 200 cells/sample were counted and classified according to item A (B). Two independent experiments were conducted. Statistical significance, ***p<0.001 vs. control and ##p<0.01 vs. Mn.
Figure 5
Figure 5. WT and Q297V Opa-1 over-expression prevent apoptotic nuclei appearance.
Normal and apoptotic (condensed and fragmented chromatin) (arrowheads) nuclei were detected with Hoechst 33258 (1 µg/ml) by fluorescence microscopy and 200 cells/sample were scored. Scale bar: 10 µm. Two independent experiments were conducted. Statistical significance, **p<0.01 and ***p<0.001 vs. control; ###p<0.001 vs. Mn.
Figure 6
Figure 6. CsA prevents Mn-induced Opa-1 cleavage and Drp-1 translocation to mitochondria.
Opa-1 expression levels in total cell lysates. Anti-β- Actin antibody was used as a loading control (A); Drp-1 expression levels in enriched-mitochondrial and cytosolic fractions. Membranes were stripped and reprobed for anti-Complex III subunit core 1- OxPhos (Complex III) I and anti-β- Actin as loading control (B); CsA diminishes Mn-induced mitochondrial fragmentation, loss of Δψm and apoptotic nuclei appeareance. Quantification of mitochondria (C) and nuclei morphology (D) classified according to Figs. 4, 5. Scale bar: 10 µm. Three independent experiments were conducted. Statistical significance, **p<0.01 and ***p<0.001 vs. control; ##p<0.01 vs. Mn. Arrowheads: apoptotic (condensed and fragmented chromatin) nuclei.
Figure 7
Figure 7. Mdivi-1 protects from Mn injury.
Viability was measured by MTT assay (A); Quantification of mitochondrial morphology and Δψm dissipation analysis using MitoTracker Red CMXRos (75 nM) (B); Apoptotic nuclei were determined by staining with Hoechst 33258 (arrowheads). Scale bar: 10 µm (C). Results are average of three individual experiments. Statistical significance, **p<0.01 and ***p<0.001 vs. control; #p<0.05, ##p<0.01 and ###p<0.001 vs. Mn.
Figure 8
Figure 8. Drp-1 siRNA prevents Mn damage.
Western blot analysis of Drp-1 protein in C6 cells transfected with pooled Drp-1 or control siRNA for 48 hours. Reprobing with an anti-β-Actin antibody was performed to normalize for protein loading. Results are expressed as a percentage of the respective control considered as 100%. Viability was measured by MTT assay (A); Quantification of mitochondrial morphology and Δψm dissipation analysis using MitoTracker Red CMXRos (75 nM) (B); Apoptotic nuclei were determined by Hoechst 33258 staining (arrowheads). Scale bar: 10 µm (C). Results are average of three individual experiments. Statistical significance, **p<0.01 and ***p<0.001 vs. control; ###p<0.001 vs. Mn.
Figure 9
Figure 9
Mn induced damage into rat striatal tissue (A). Rats were injected into the striatum with 1 µmol Mn (left) and saline solution (right), as indicated with dotted lines. Nissl staining on vibratome brain sections containing striatum from Mn-treated (a,b) and control (c,d) rats (B). Magnification: 10X (a,c) and 40X (b,d); Nuclei staining (C). Arrowheads: cells with shrunken shape and pyknotic nuclei. Magnification: 100X. Samples correspond to sections from rats receiving a single striatum injection of Mn and euthanized 7 days after. Scale bar: 10 µm.
Figure 10
Figure 10. Opa-1 and Drp-1 expression in rat striatum.
Representative immunohistochemistry images of Opa-1 (upper panel) and Drp-1 (lower panel). Samples correspond to sections from rats receiving a single (left) striatum injection of Mn (a,b,e,f) or a single (right) striatum injection of saline (c,d,g,h) and euthanized 7 days after. Magnification: 10X (a,c,e,g) and 40X (b,d,f,h). Scale bar: 10 µm.

References

    1. Couper J (1837) On the effects of black oxide of manganese when inhaled in the lungs. Br Ann Med Pharmacol 1: 41–42.
    1. Roth JA (2009) Are there common biochemical and molecular mechanisms controlling manganism and parkisonism. Neuromolecular Med 11: 281–96. - PubMed
    1. Benedetto A, Au C, Aschner M (2009) Manganese-Induced Dopaminergic Neurodegeneration: Insights into Mechanisms and Genetics Shared with Parkinson Disease. Chem Rev 109: 4862–4884. - PubMed
    1. Olanow CW (2004) Manganese-induced parkinsonism and Parkinson’s disease. Ann NY Acad Sci 1012: 209–23. - PubMed
    1. Zhao F, Cai T, Liu M, Zheng G, Luo W, et al. (2009) Manganese induces dopaminergic neurodegeneration via microglial activation in a rat model of manganism. Toxicol Sci 107: 156–64. - PubMed

Publication types

MeSH terms

LinkOut - more resources