

Analyzing clonal variation of monoclonal antibody-producing CHO cell lines using an in silico metabolomic platform
- PMID: 24632968
- PMCID: PMC3954614
- DOI: 10.1371/journal.pone.0090832
Analyzing clonal variation of monoclonal antibody-producing CHO cell lines using an in silico metabolomic platform
Erratum in
- PLoS One. 2014;9(8):e104725
Abstract
Monoclonal antibody producing Chinese hamster ovary (CHO) cells have been shown to undergo metabolic changes when engineered to produce high titers of recombinant proteins. In this work, we have studied the distinct metabolism of CHO cell clones harboring an efficient inducible expression system, based on the cumate gene switch, and displaying different expression levels, high and low productivities, compared to that of the parental cells from which they were derived. A kinetic model for CHO cell metabolism was further developed to include metabolic regulation. Model calibration was performed using intracellular and extracellular metabolite profiles obtained from shake flask batch cultures. Model simulations of intracellular fluxes and ratios known as biomarkers revealed significant changes correlated with clonal variation but not to the recombinant protein expression level. Metabolic flux distribution mostly differs in the reactions involving pyruvate metabolism, with an increased net flux of pyruvate into the tricarboxylic acid (TCA) cycle in the high-producer clone, either being induced or non-induced with cumate. More specifically, CHO cell metabolism in this clone was characterized by an efficient utilization of glucose and a high pyruvate dehydrogenase flux. Moreover, the high-producer clone shows a high rate of anaplerosis from pyruvate to oxaloacetate, through pyruvate carboxylase and from glutamate to α-ketoglutarate, through glutamate dehydrogenase, and a reduced rate of cataplerosis from malate to pyruvate, through malic enzyme. Indeed, the increase of flux through pyruvate carboxylase was not driven by an increased anabolic demand. It is in fact linked to an increase of the TCA cycle global flux, which allows better regulation of higher redox and more efficient metabolic states. To the best of our knowledge, this is the first time a dynamic in silico platform is proposed to analyze and compare the metabolomic behavior of different CHO clones.
Conflict of interest statement
Figures


 or activated
  by an effector “α”. The corresponding activation/inhibition terms are labeled as I, II, III, IV, and V. The bottom diagram represents model simulations for parental, induced low- and induced high-producer cell lines with no regulation (solid black line), with the addition of term I (solid red line), with the addition of terms I and II (solid blue line), and the addition of all terms (solid green line). Experimental data are represented by triangles (parental culture), squares (induced low-producing culture), and circles (induced high-producing culture) for cell density (A), glucose (B), ATP-to-ADP ratio (C), and NADH-to-NAD ratio (D). Error bars are standard deviations from duplicate flasks. Error bars are standard deviations for duplicate cultures.
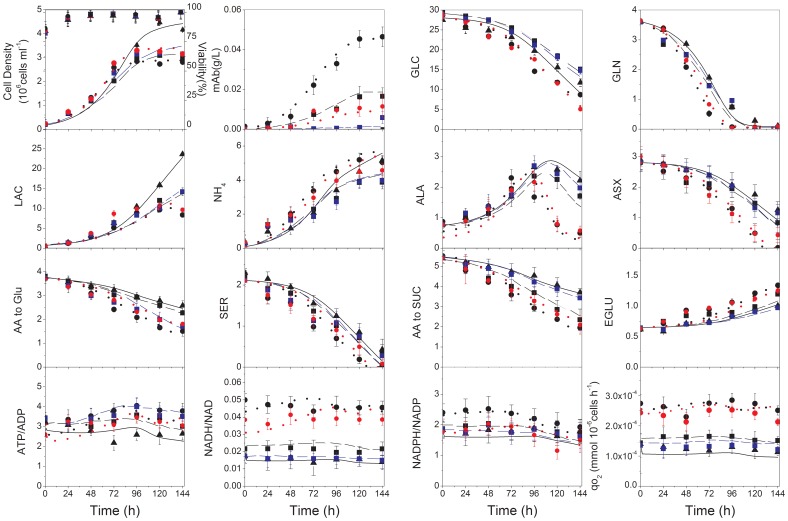

Similar articles
-
Metabolic flux analysis of CHO cells at growth and non-growth phases using isotopic tracers and mass spectrometry.Metab Eng. 2011 Sep;13(5):598-609. doi: 10.1016/j.ymben.2011.07.002. Epub 2011 Aug 2. Metab Eng. 2011. PMID: 21821143
-
Preventing pyruvate kinase muscle expression in Chinese hamster ovary cells curbs lactogenic behavior by altering glycolysis, gating pyruvate generation, and increasing pyruvate flux into the TCA cycle.Biotechnol Prog. 2021 Sep;37(5):e3193. doi: 10.1002/btpr.3193. Epub 2021 Jul 28. Biotechnol Prog. 2021. PMID: 34288605
-
Metabolic engineering of CHO cells for the development of a robust protein production platform.PLoS One. 2017 Aug 1;12(8):e0181455. doi: 10.1371/journal.pone.0181455. eCollection 2017. PLoS One. 2017. PMID: 28763459 Free PMC article.
-
Carboxylation and anaplerosis in neurons and glia.Mol Neurobiol. 2000 Aug-Dec;22(1-3):21-40. doi: 10.1385/MN:22:1-3:021. Mol Neurobiol. 2000. PMID: 11414279 Review.
-
Pyruvate carboxylation in neurons.J Neurosci Res. 2001 Dec 1;66(5):755-62. doi: 10.1002/jnr.10044. J Neurosci Res. 2001. PMID: 11746399 Review.
Cited by
-
Metabolic therapies inhibit tumor growth in vivo and in silico.Sci Rep. 2019 Feb 28;9(1):3153. doi: 10.1038/s41598-019-39109-1. Sci Rep. 2019. PMID: 30816152 Free PMC article.
-
Identifying Biomarkers of Wharton's Jelly Mesenchymal Stromal Cells Using a Dynamic Metabolic Model: The Cell Passage Effect.Metabolites. 2018 Feb 24;8(1):18. doi: 10.3390/metabo8010018. Metabolites. 2018. PMID: 29495309 Free PMC article.
-
A nanowell platform to identify, sort and expand high antibody-producing cells.Sci Rep. 2024 Apr 24;14(1):9457. doi: 10.1038/s41598-024-60054-1. Sci Rep. 2024. PMID: 38658627 Free PMC article.
-
A control strategy to investigate the relationship between specific productivity and high-mannose glycoforms in CHO cells.Appl Microbiol Biotechnol. 2016 Aug;100(16):7011-24. doi: 10.1007/s00253-016-7380-4. Epub 2016 Feb 24. Appl Microbiol Biotechnol. 2016. PMID: 26910040 Free PMC article.
-
Metabolomic Approaches to Study Chemical Exposure-Related Metabolism Alterations in Mammalian Cell Cultures.Int J Mol Sci. 2020 Sep 18;21(18):6843. doi: 10.3390/ijms21186843. Int J Mol Sci. 2020. PMID: 32961865 Free PMC article. Review.
References
-
- Pavlou AK, Belsey MJ (2008) The therapeutic antibodies market to 2008. European Journal of Pharmaceutics and Biopharmceutics 59: 389–96. - PubMed
-
- Durocher Y, Butler M (2009) Expression systems for therapeutic glycoprotein production. Current Opinion in Biotechnology 20: 700–707. - PubMed
-
- Bebbington CR, Renner G, Thomson S, King D, Abrams D, et al. (1992) High-level expression of a recombinant antibody from myeloma cells using a glutamine synthetase gene as an amplifiable selectable marker. Biotechnology (NY) 10: 169–175. - PubMed
-
- Lee YY, Wong KT, Tan J, Toh PC, Mao Y, et al. (2009) Overexpression of heat shock proteins (HSPs) in CHO cells for extended culture viability and improved recombinant protein production. Journal of Biotechnology 143: 34–43. - PubMed
-
- Bi JX, Shuttleworth J, Al-Rubeai M (2004) Uncoupling of cell growth and proliferation results in enhancement of productivity in p21CIP1-arrested CHO cells. Biotechnology and Bioengineering 85: 741–749. - PubMed
Publication types
MeSH terms
Substances
LinkOut - more resources
Full Text Sources
Other Literature Sources
